

Question: The data show representative binodal curves for various polystyrene ( PS ) in cyclopentane ( CP ) ( narrow fractions covering a molecular weight range
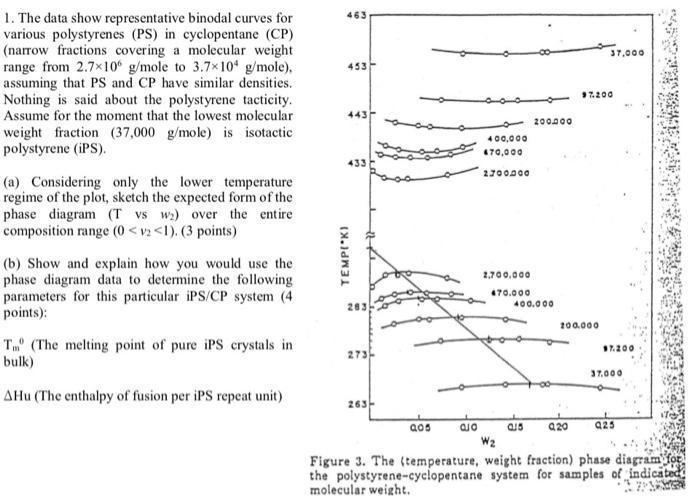
The data show representative binodal curves for various polystyrene PS in cyclopentane CPnarrow fractions covering a molecular weight range from gmole to gmole assuming that PS and CP have similar densities. Nothing is said about the polystyrene tactictiy. Assume for the moment that the lowest molecular weight fraction gmole is isotactic polystyrene.The data show representative binodal curves for various polystyrenes PS in cyclopentane CPnarrow fractions covering a molecular weight
range from mole to ole
assuming that PS and CP have similar densities.
Nothing is said about the polystyrene tacticity.
Assume for the moment that the lowest molecular
weight fraction ole is isotactic
polystyrene iPS
a Considering only the lower temperature
regime of the plot, sketch the expected form of the
phase diagram vs over the entire
composition range
Step by Step Solution
There are 3 Steps involved in it
1 Expert Approved Answer
Step: 1 Unlock

Question Has Been Solved by an Expert!
Get step-by-step solutions from verified subject matter experts
Step: 2 Unlock
Step: 3 Unlock