

Question: The data shown below for the dependent variable, y, and the independent variable, x, have been collected using simple random sampling. 11 13 16 12
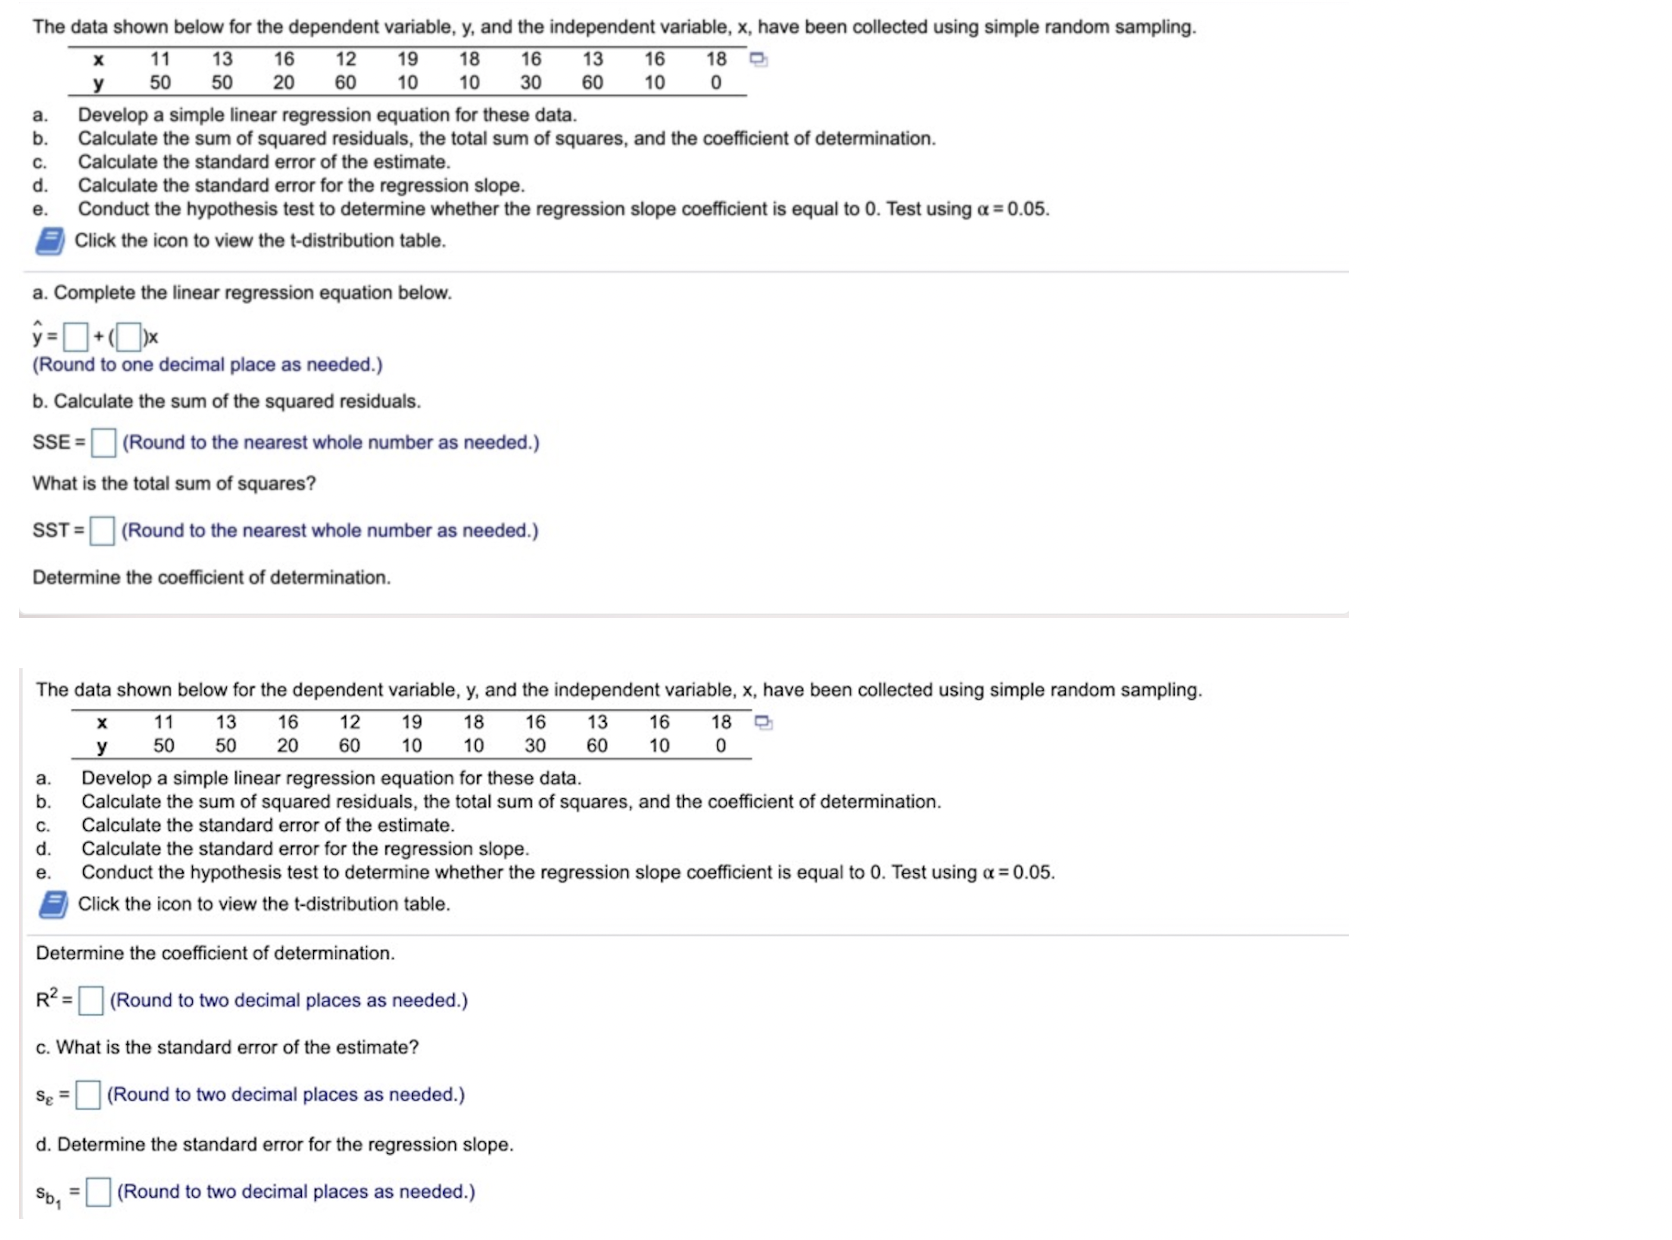
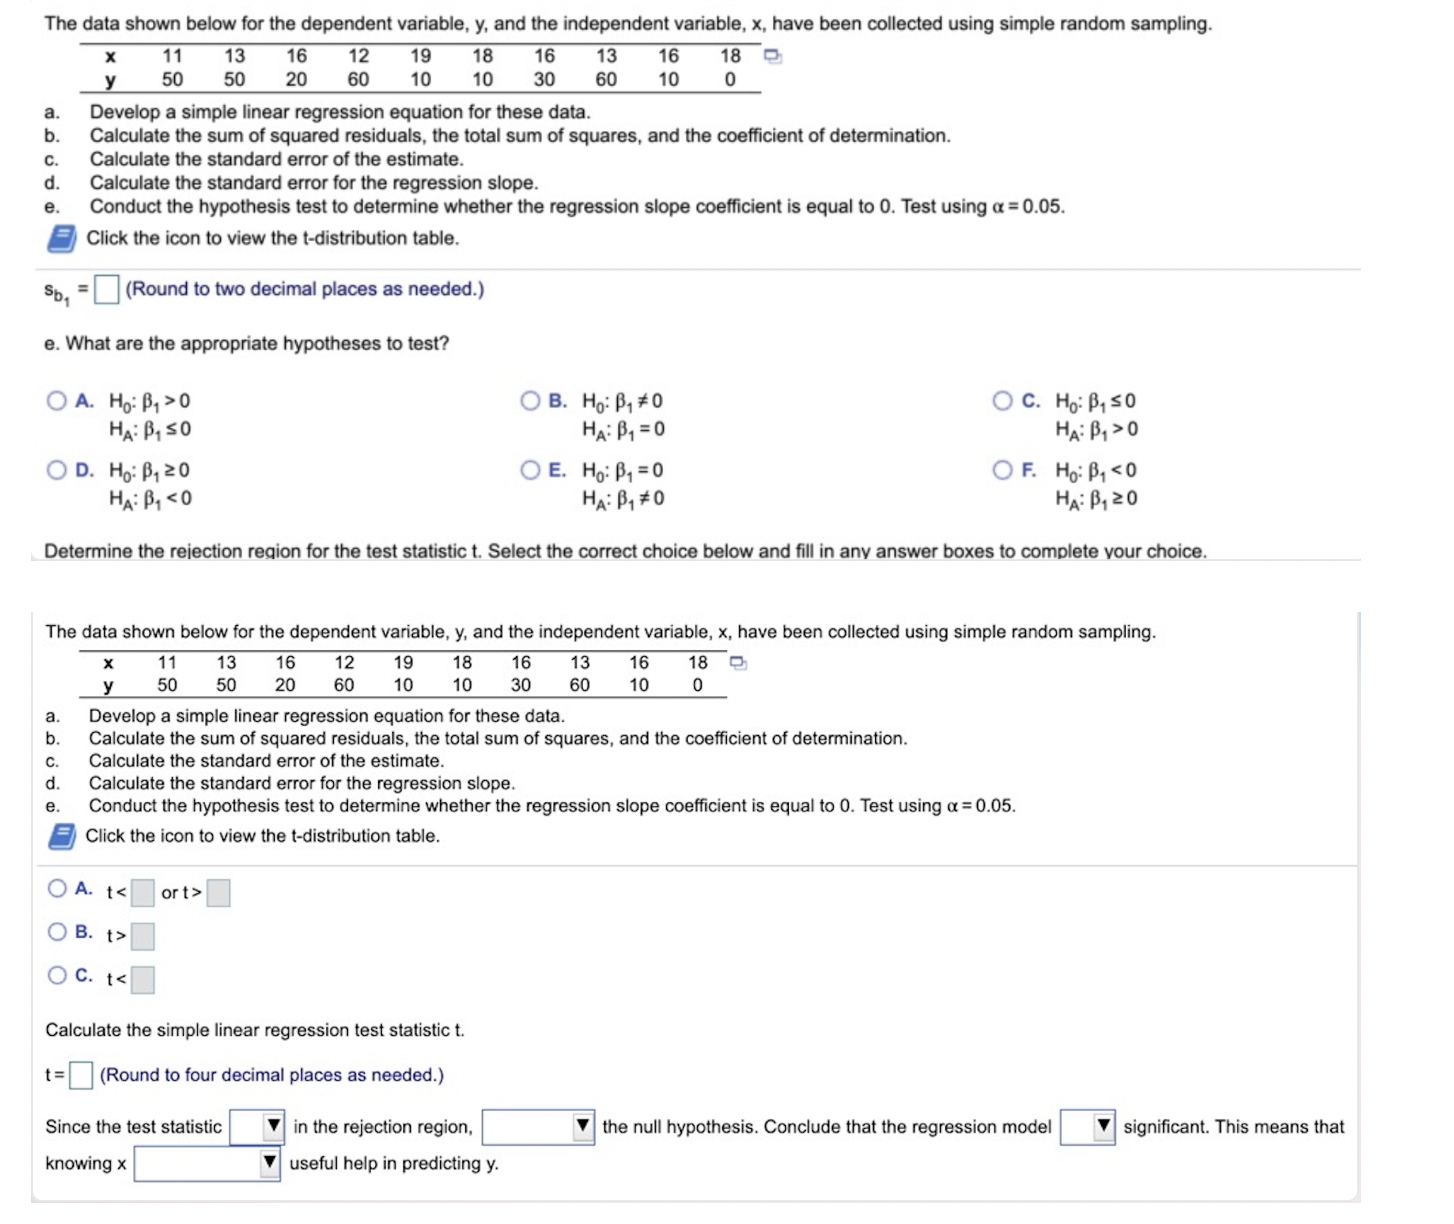
The data shown below for the dependent variable, y, and the independent variable, x, have been collected using simple random sampling. 11 13 16 12 19 18 16 13 16 18 9 50 50 20 60 10 10 30 60 10 0 Develop a simple linear regression equation for these data. Calculate the sum of squared residuals, the total sum of squares, and the coefficient of determination. 29 Calculate the standard error of the estimate. d. Calculate the standard error for the regression slope. Conduct the hypothesis test to determine whether the regression slope coefficient is equal to 0. Test using a = 0.05. Click the icon to view the t-distribution table. a. Complete the linear regression equation below. y = [+()x (Round to one decimal place as needed.) b. Calculate the sum of the squared residuals. SSE = (Round to the nearest whole number as needed.) What is the total sum of squares? SST = (Round to the nearest whole number as needed.) Determine the coefficient of determination. The data shown below for the dependent variable, y, and the independent variable, x, have been collected using simple random sampling. 11 13 16 12 19 18 16 13 16 18 50 50 20 60 10 10 30 60 10 0 Develop a simple linear regression equation for these data. Calculate the sum of squared residuals, the total sum of squares, and the coefficient of determination. Calculate the standard error of the estimate. Calculate the standard error for the regression slope. e. Conduct the hypothesis test to determine whether the regression slope coefficient is equal to 0. Test using a = 0.05. Click the icon to view the t-distribution table. Determine the coefficient of determination. R2 = (Round to two decimal places as needed.) c. What is the standard error of the estimate? Se =(Round to two decimal places as needed.) d. Determine the standard error for the regression slope. So, = (Round to two decimal places as needed.)The data shown below for the dependent variable, y, and the independent variable, x, have been collected using simple random sampling. 11 13 16 12 19 18 16 13 16 18 50 50 20 60 10 10 30 60 10 0 po Develop a simple linear regression equation for these data. Calculate the sum of squared residuals, the total sum of squares, and the coefficient of determination. 29 Calculate the standard error of the estimate. Calculate the standard error for the regression slope. Conduct the hypothesis test to determine whether the regression slope coefficient is equal to 0. Test using a = 0.05. Click the icon to view the t-distribution table. So, =(Round to two decimal places as needed.) e. What are the appropriate hypotheses to test? O A. Ho: B, >0 OB. Ho: B, #0 O C. Ho: B, So HA: B, SO HA: B1 = 0 HA: B, >0 OD. Ho: B, 20 OE. Ho: B, = 0 OF. Ho: B, O B. > O c. to Calculate the simple linear regression test statistic t. t= (Round to four decimal places as needed.) Since the test statistic in the rejection region, the null hypothesis. Conclude that the regression model significant. This means that knowing x useful help in predicting y
Step by Step Solution
There are 3 Steps involved in it

Get step-by-step solutions from verified subject matter experts