

Question: The data shown below for the dependent variable, y, and the independent variable, x, have been collected using simple random sampling. X 31.4 5.7 14.4
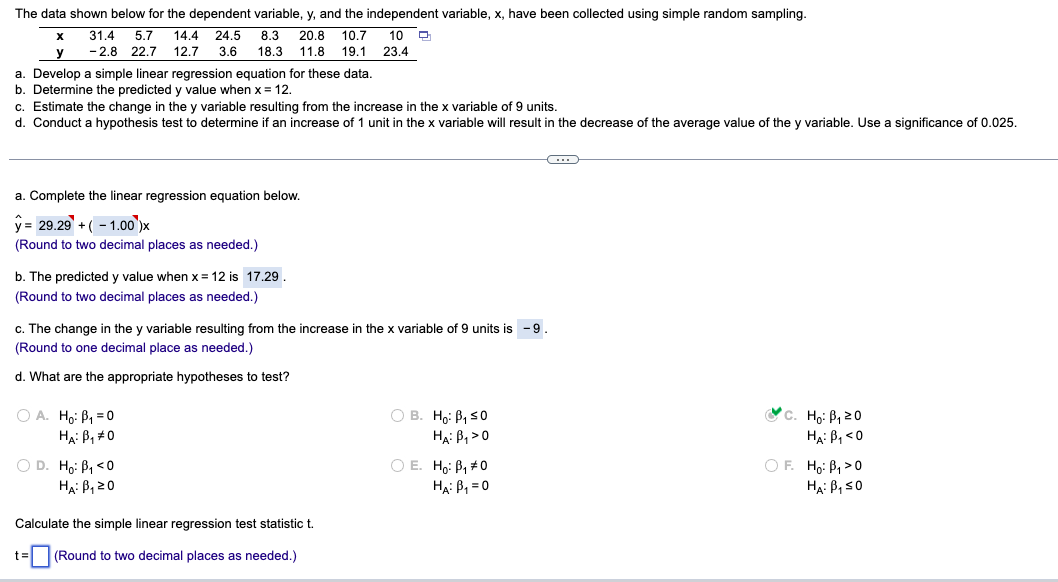
The data shown below for the dependent variable, y, and the independent variable, x, have been collected using simple random sampling. X 31.4 5.7 14.4 24.5 8.3 20.8 10.7 10 -2.8 22.7 12.7 3.6 18.3 11.8 19.1 23.4 a. Develop a simple linear regression equation for these data. b. Determine the predicted y value when x = 12. c. Estimate the change in the y variable resulting from the increase in the x variable of 9 units. d. Conduct a hypothesis test to determine if an increase of 1 unit in the x variable will result in the decrease of the average value of the y variable. Use a significance of 0.025. a. Complete the linear regression equation below. y = 29.29 + ( - 1.00 )x (Round to two decimal places as needed.) b. The predicted y value when x = 12 is 17.29 . (Round to two decimal places as needed.) c. The change in the y variable resulting from the increase in the x variable of 9 units is - 9. (Round to one decimal place as needed.) d. What are the appropriate hypotheses to test? O A. Ho: P1 = 0 OB. Ho: B, SO C. Ho: B, 20 HA: B, #0 HA: B, >0 HA: B, 0 HA: B, 20 HA: B, =0 HA: B, SO Calculate the simple linear regression test statistic t. t=(Round to two decimal places as needed.)
Step by Step Solution
There are 3 Steps involved in it

Get step-by-step solutions from verified subject matter experts