

Question: ASSIGNMENT 8 The data shown below for the dependent variable, y, and the independent variable, x, have been collected using simple random sampling. X 11
ASSIGNMENT 8
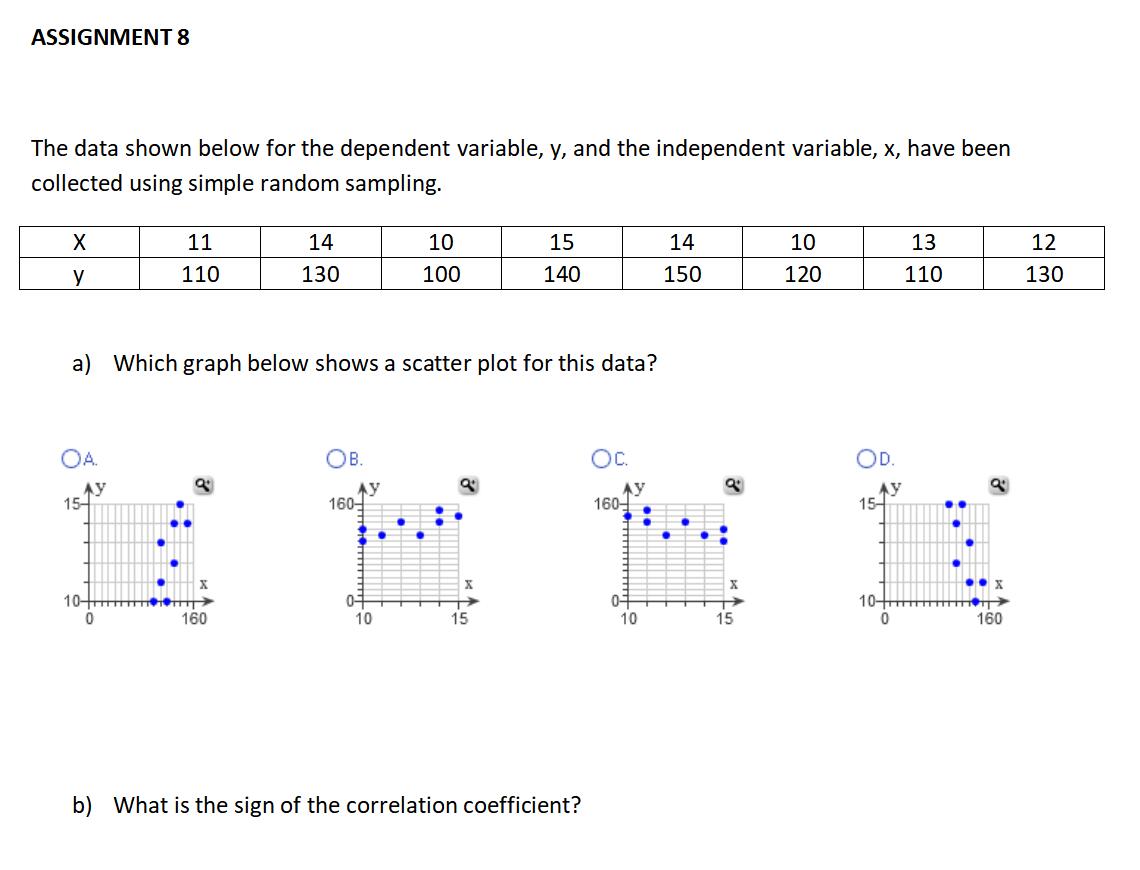
The data shown below for the dependent variable, y, and the independent variable, x, have been collected using simple random sampling.
X
11
14
10
15
14
10
13
12
y
110
130
100
140
150
120
110
130
a)Which graph below shows a scatter plot for this data?
b)What is the sign of the correlation coefficient?
ASSIGNMENT 8 The data shown below for the dependent variable, y, and the independent variable, x, have been collected using simple random sampling. X 11 14 10 15 14 10 13 12 y 110 130 100 140 150 120 110 130 3) Which graph below shows a scatter plot for this data? b) What is the sign of the correlation coefficient
Step by Step Solution
There are 3 Steps involved in it
1 Expert Approved Answer
Step: 1 Unlock

Question Has Been Solved by an Expert!
Get step-by-step solutions from verified subject matter experts
Step: 2 Unlock
Step: 3 Unlock