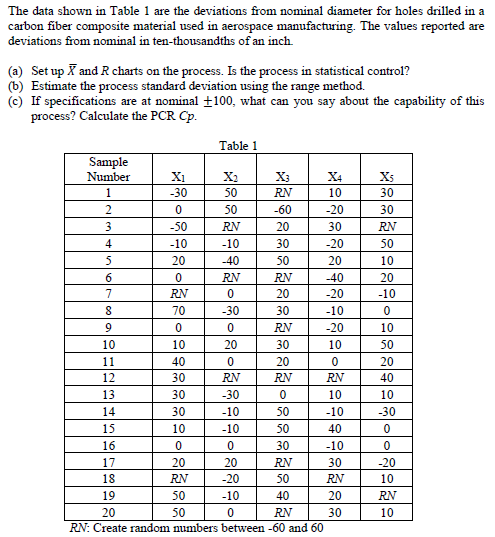
Question: The data shown in Table 1 are the deviations from nominal diameter for holes drilled in a carbon fiber composite material used in aerospace manufacturing.

The data shown in Table 1 are the deviations from

The data shown in Table 1 are the deviations from nominal diameter for holes drilled in a carbon fiber composite material used in aerospace manufacturing. The values reported are deviations from nominal in ten-thousandths of an inch (a) Set up X and R charts on the process. Is the process in statistical control? (6) Estimate the process standard deviation using the range method. C) If specifications are at nominal +100, what can you say about the capability of this process? Calculate the PCR Cp. Table 1 Sample Number Xi X2 X4 1 -30 50 RN 10 2 0 50 -60 -20 3 -50 RN 20 30 4 -10 -10 30 -20 5 20 -40 50 20 6 0 RN RN -40 7 RN 0 20 -20 8 70 -30 30 -10 9 0 0 RN -20 10 10 20 30 10 11 40 0 20 0 12 30 RN RN RN 13 30 -30 0 10 14 30 -10 50 -10 15 10 -10 50 40 16 0 0 30 -10 17 20 20 RN 30 18 RN -20 50 RN 19 50 -10 40 20 20 SO 0 RN 30 RN: Create random numbers between -60 and 60 Xs 30 30 RN 50 10 20 -10 0 10 50 20 40 10 -30 0 0 -20 10 RN 10

Step by Step Solution

There are 3 Steps involved in it

1 Expert Approved Answer
Step: 1 Unlock blur-text-image
Question Has Been Solved by an Expert!

Get step-by-step solutions from verified subject matter experts

Step: 2 Unlock
Step: 3 Unlock

Students Have Also Explored These Related General Management Questions!