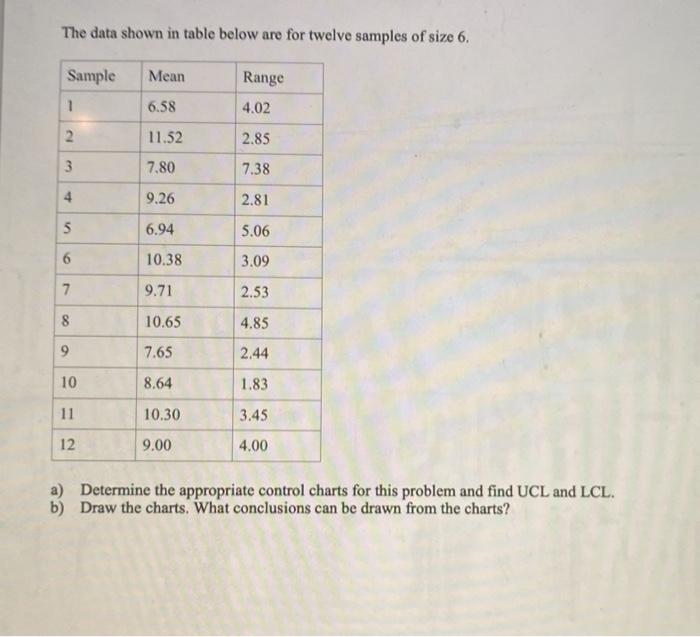
Question: The data shown in table below are for twelve samples of size 6. Sample Mean Range 1 6.58 4.02 2 11.52 2.85 3 7.80 7.38

The data shown in table below are for twelve
The data shown in table below are for twelve samples of size 6. Sample Mean Range 1 6.58 4.02 2 11.52 2.85 3 7.80 7.38 4. 9.26 2.81 $ 6.94 5.06 6 10.38 3.09 7 9.71 2.53 8 10.65 4.85 9 7.65 2.44 10 8.64 1.83 11 10.30 3.45 12 9.00 4.00 a) Determine the appropriate control charts for this problem and find UCL and LCL. b) Draw the charts. What conclusions can be drawn from the charts

Step by Step Solution

There are 3 Steps involved in it

1 Expert Approved Answer
Step: 1 Unlock blur-text-image
Question Has Been Solved by an Expert!

Get step-by-step solutions from verified subject matter experts

Step: 2 Unlock
Step: 3 Unlock

Students Have Also Explored These Related General Management Questions!