

Question: The data ^ solve A With the data set in picture 1, can you solve B and C with work shown? Thank you Lenovo uses

The data ^ solve A
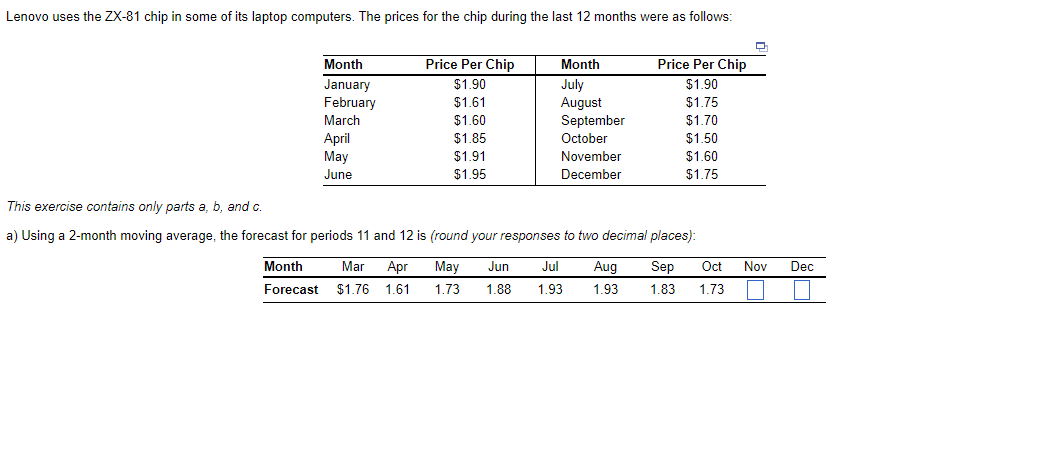
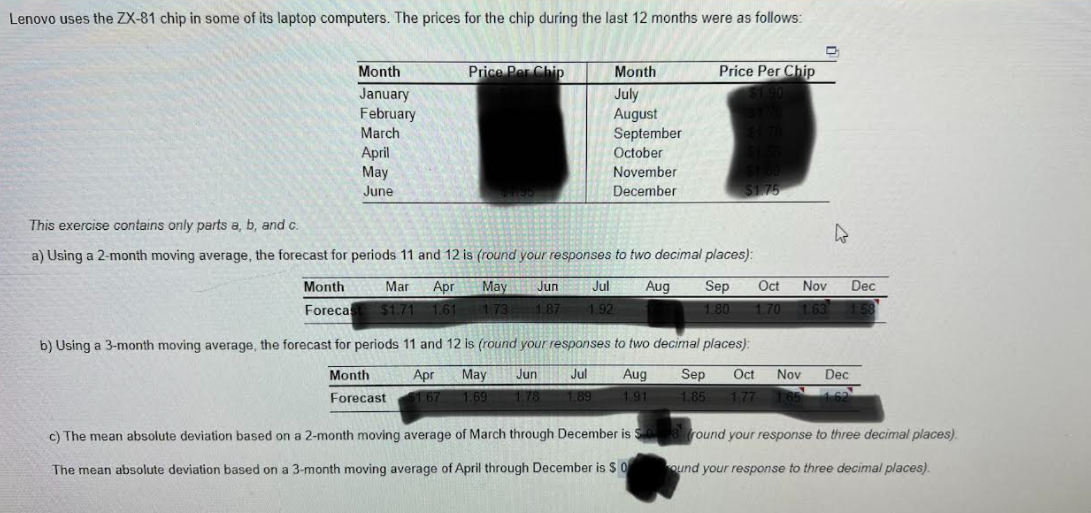 With the data set in picture 1, can you solve B and C with work shown? Thank you
Step by Step Solution
There are 3 Steps involved in it
1 Expert Approved Answer
Step: 1 Unlock

Question Has Been Solved by an Expert!
Get step-by-step solutions from verified subject matter experts
Step: 2 Unlock
Step: 3 Unlock