

Question: The demand for roses was estimated using quarterly figures for the period 1971 (3rd quarter) to 1975 (2nd quarter). Two models were estimated and
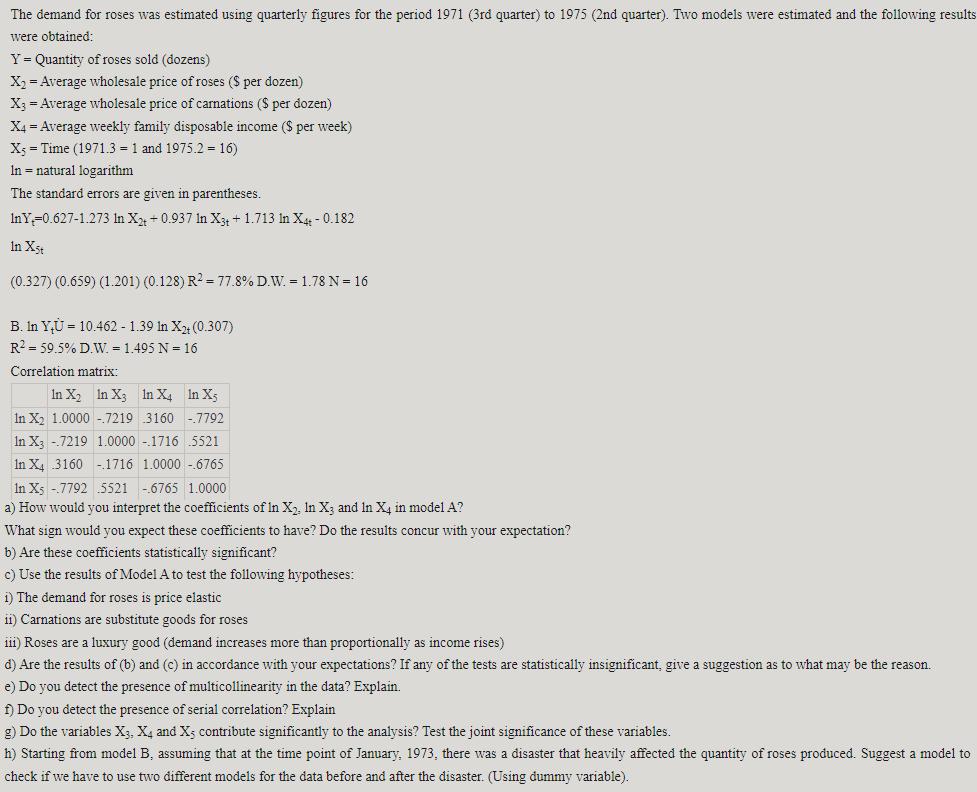
The demand for roses was estimated using quarterly figures for the period 1971 (3rd quarter) to 1975 (2nd quarter). Two models were estimated and the following results were obtained: Y = Quantity of roses sold (dozens) X = Average wholesale price of roses ($ per dozen) X3 = Average wholesale price of carnations ($ per dozen) X4 = Average weekly family disposable income ($ per week) X = Time (1971.3 = 1 and 1975.2 = 16) In natural logarithm The standard errors are given in parentheses. InY=0.627-1.273 In X2+ - 0.937 In X3t + 1.713 In X4 -0.182 In Xst (0.327) (0.659) (1.201) (0.128) R = 77.8 % D.W. = 1.78 N = 16 B. In YU 10.462 - 1.39 In X+ (0.307) R = 59.5% D.W. = 1.495 N = 16 Correlation matrix: In X In X3 In X4 In X; In X 1.0000-.7219 3160 -7792 In X3 7219 1.0000 -1716 5521 In X 3160 -1716 1.0000 -6765 In Xs -.7792 5521-6765 1.0000 a) How would you interpret the coefficients of In X. In X3 and In X4 in model A? What sign would you expect these coefficients to have? Do the results concur with your expectation? b) Are these coefficients statistically significant? c) Use the results of Model A to test the following hypotheses: i) The demand for roses is price elastic ii) Carnations are substitute goods for roses iii) Roses are a luxury good (demand increases more than proportionally as income rises) d) Are the results of (b) and (c) in accordance with your expectations? If any of the tests are statistically insignificant, give a suggestion as to what may be the reason. e) Do you detect the presence of multicollinearity in the data? Explain. f) Do you detect the presence of serial correlation? Explain g) Do the variables X3, X4 and X; contribute significantly to the analysis? Test the joint significance of these variables. h) Starting from model B, assuming that at the time point of January, 1973, there was a disaster that heavily affected the quantity of roses produced. Suggest a model to check if we have to use two different models for the data before and after the disaster. (Using dummy variable).
Step by Step Solution
3.40 Rating (153 Votes )
There are 3 Steps involved in it
a Using Model A Independent Variable lnX 2 Keeping all the other conditions constant for every 1 unit increase in the independent variable there is de... View full answer

Get step-by-step solutions from verified subject matter experts