

The demand for roses. The following table gives quarterly data on these variables: Y = quantity of
Question:
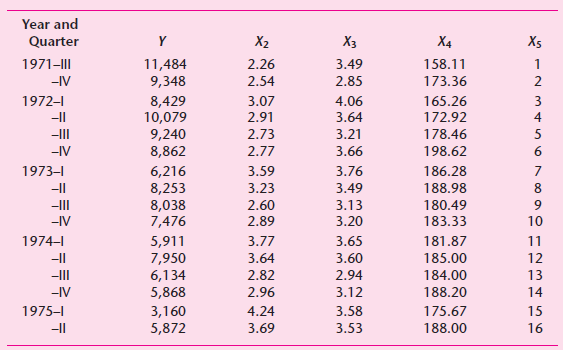
The demand for roses. The following table gives quarterly data on these variables:
Y = quantity of roses sold, dozens
X2= average wholesale price of roses, $/dozen
X3= average wholesale price of carnations, $/dozen
X4= average weekly family disposable income, $/week
X5= the trend variable taking values of 1, 2, and so on, for the period 1971–III to 1975–II in the Detroit metropolitan area
You are asked to consider the following demand functions:
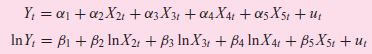
a. Estimate the parameters of the linear model and interpret the results.
b. Estimate the parameters of the log–linear model and interpret the results.
c. β2, β3, and β4 give, respectively, the own-price, cross-price, and income elasticities of demand. What are their a priori signs? Do the results concur with the a priori expectations?
d. How would you compute the own-price, cross-price, and income elasticities for the linear model?
e. On the basis of your analysis, which model, if either, would you choose and why?
Step by Step Answer:
a Linear Model Y t 1081604 2227704 X 2i 1251141 X 3i 6283 X 4i 197399 X 5i se 5988348 920538 1157021 ...View the full answer


