

Question: The diagram below shows an input network for the minimum-cost flow problem, and the flow (shown in red) in this network at the end of
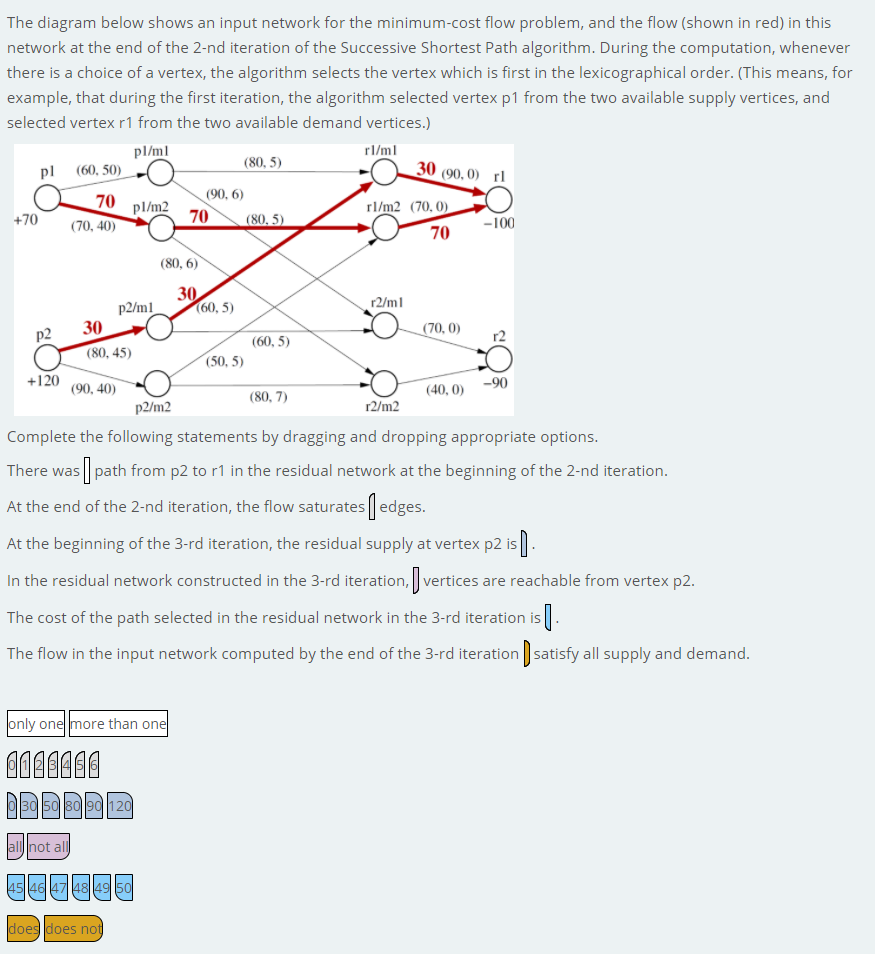
The diagram below shows an input network for the minimum-cost flow problem, and the flow (shown in red) in this network at the end of the 2-nd iteration of the Successive Shortest Path algorithm. During the computation, whenever there is a choice of a vertex, the algorithm selects the vertex which is first in the lexicographical order. (This means, for example, that during the first iteration, the algorithm selected vertex p1 from the two available supply vertices, and selected vertex r1 from the two available demand vertices.) pl/m1 r/m1 (80,5) pl (60,50) 70 (90, 6) pl/m2 r/m2 (70,0) 70 (70,40) (80,5) -100 30 (90,0) 1 +70 70 P2 r2 -90 (80,6) 30 p2/ml (60,5) r2/m1 30 (70,0) (60,5) (80, 45) (50,5) +120 (90, 40) (80,7) (40,0) p2/m2 r2/m2 Complete the following statements by dragging and dropping appropriate options. There was | path from p2 to r1 in the residual network at the beginning of the 2-nd iteration. At the end of the 2-nd iteration, the flow saturates [ edges. At the beginning of the 3-rd iteration, the residual supply at vertex p2 is). In the residual network constructed in the 3-rd iteration, vertices are reachable from vertex p2. The cost of the path selected in the residual network in the 3-rd iteration is l. The flow in the input network computed by the end of the 3-rd iteration ) satisfy all supply and demand. only one more than one 0000000 305080190 120 Jall not all 45146147 148 149 150 does does not
Step by Step Solution
There are 3 Steps involved in it

Get step-by-step solutions from verified subject matter experts