

Question: The digraphs in Figure 4.17 were obtained by adding nodes and edges to the digraph in Figure 4.5. Compute the cyclomatic complexity of each new
The digraphs in Figure 4.17 were obtained by adding nodes and edges to the digraph in Figure 4.5. Compute the cyclomatic complexity of each new digraph and explain how the changes affected the complexity.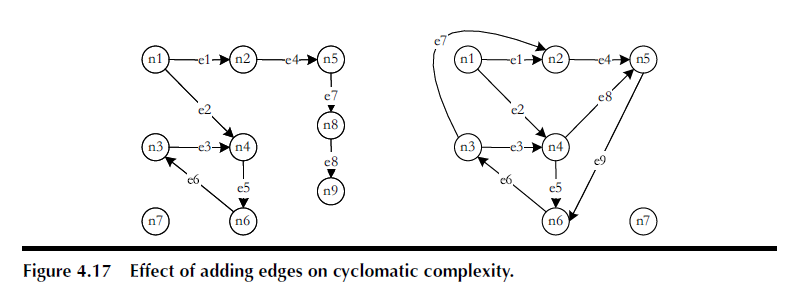
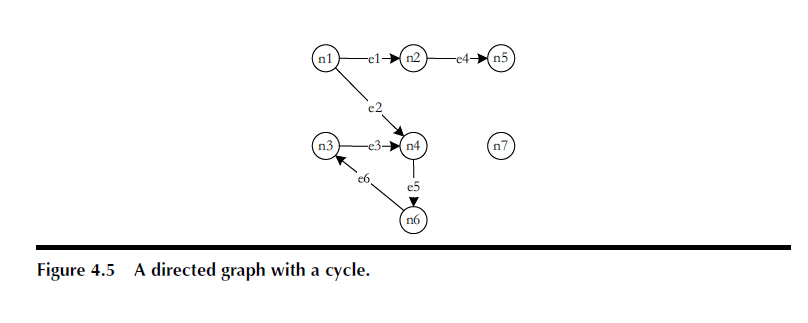
n1 n2 n5 n1 n2 -e4- n5 e8 (n8 n3 n4 n3 n4 e8 ng n7 n6 n6 n7 Figure 4.17 Effect of adding edges on cyclomatic complexity. n1 -el-n2 -e4n5 n3 n4 n7 e5 no Figure 4.5 A directed graph with a cycle
Step by Step Solution
There are 3 Steps involved in it
1 Expert Approved Answer
Step: 1 Unlock

Question Has Been Solved by an Expert!
Get step-by-step solutions from verified subject matter experts
Step: 2 Unlock
Step: 3 Unlock