

Question: The distribution for one-year change in value (units=%; do not convert to a proportion!) for 32 National Football League (NFL) teams can be summarized using

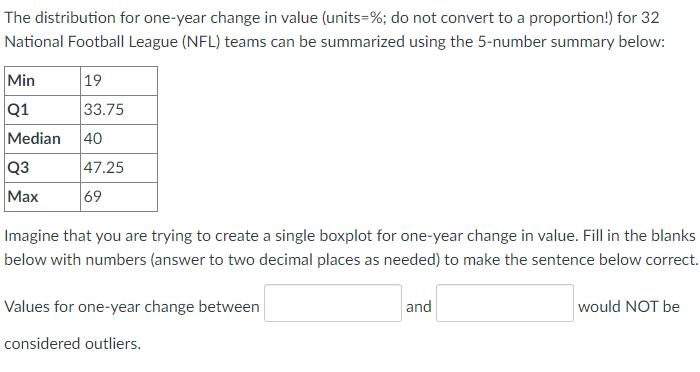
The distribution for one-year change in value (units=%; do not convert to a proportion!) for 32 National Football League (NFL) teams can be summarized using the 5-number summary below: Min 19 Q1 33.75 Median 40 Q3 47.25 Max 69 Imagine that you are trying to create a single boxplot for one-year change in value. Fill in the blanks below with numbers (answer to two decimal places as needed) to make the sentence below correct. Values for one-year change between and would NOT be considered outliers
Step by Step Solution
There are 3 Steps involved in it
1 Expert Approved Answer
Step: 1 Unlock

Question Has Been Solved by an Expert!
Get step-by-step solutions from verified subject matter experts
Step: 2 Unlock
Step: 3 Unlock