

Question: The Excel output below was generated for a linear regression model that attempts to predict miles per gallon achieved by automobiles. The independent variables include
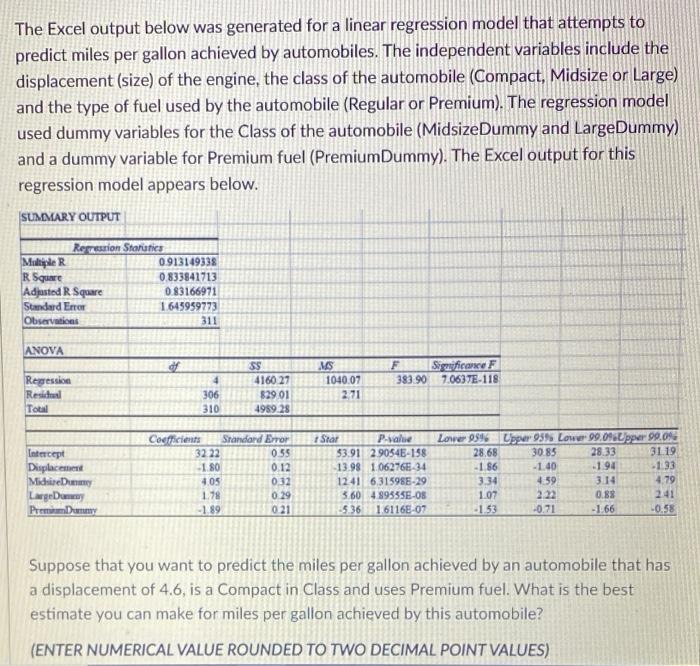
The Excel output below was generated for a linear regression model that attempts to predict miles per gallon achieved by automobiles. The independent variables include the displacement (size) of the engine, the class of the automobile (Compact, Midsize or Large) and the type of fuel used by the automobile (Regular or Premium). The regression model used dummy variables for the Class of the automobile (MidsizeDummy and LargeDummy) and a dummy variable for Premium fuel (PremiumDummy). The Excel output for this regression model appears below. SUMMARY OUTPUT Restion Statutes Multiple R 0913149338 R Square 0.833841713 Adjusted R Square 0.83166971 Standard Error 1645959773 Observations 311 ANOVA of F 383 90 Significance F 7.063 TE-118 Regression Residual Total MS 1040.07 2.71 4 306 310 SS 416027 829 01 4959 28 Intercept Displacement Midi Large Domy Premium Coefficient Srandard Error 3222 035 1 80 0.12 405 032 1.74 0.29 -1.89 021 Star P-value $3.91 29054E-158 13.98 1.062765-34 1241 6.315985-29 5.60 4.9955SE-OS -5.36 1 6116E-07 Lower 959 Uppur 9395 Lower 99.09. Lppur 99.09 28.68 30.85 28.33 31 19 -1 86 -1.40 -1.94 133 3.34 4.59 3.14 4.79 1.07 2.22 0.88 2.41 -1.53 -0.71 -1.66 -0.58 Suppose that you want to predict the miles per gallon achieved by an automobile that has a displacement of 4.6, is a Compact in Class and uses Premium fuel. What is the best estimate you can make for miles per gallon achieved by this automobile? (ENTER NUMERICAL VALUE ROUNDED TO TWO DECIMAL POINT VALUES)
Step by Step Solution
There are 3 Steps involved in it

Get step-by-step solutions from verified subject matter experts