

Question: The Excel output below was generated for a linear regression model that attempts to predict miles per gallon achieved by automobiles. The independent variables include
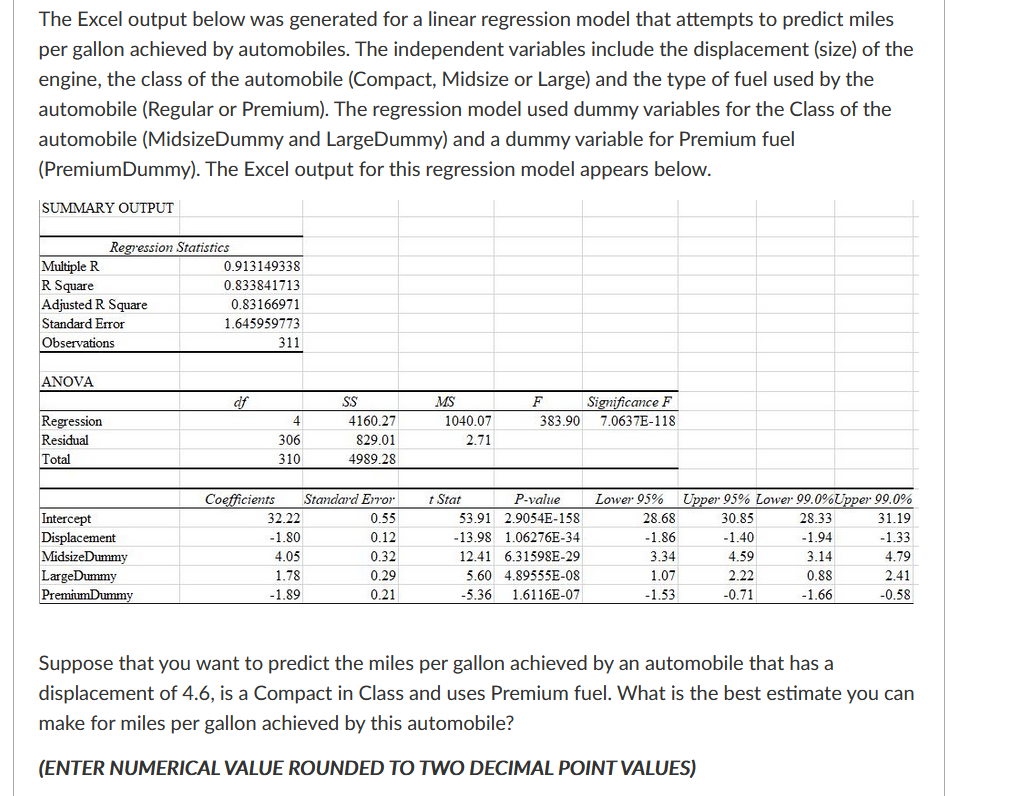
The Excel output below was generated for a linear regression model that attempts to predict miles per gallon achieved by automobiles. The independent variables include the displacement (size) of the engine, the class of the automobile (Compact, Midsize or Large) and the type of fuel used by the automobile (Regular or Premium). The regression model used dummy variables for the Class of the automobile (MidsizeDummy and LargeDummy) and a dummy variable for Premium fuel (PremiumDummy). The Excel output for this regression model appears below. SUMMARY OUTPUT 3333215193: Smscs Miitiple R (1913149338 R Square _ 08338-41713 Adjusted R Square _ 083166971 Standard Error _ 1.645959773_ Observations 311 ANOVA if SS M? F Signicance F Regression I 4 4160.21 10410.01I 333.90 1063713418 Residual I 306I 829.01 2.71 Total 310 4989.28 C aims 5':de Error ISM! Famine Lower 95% U 45% Lower 99.0%U 99.0% Intercept 32.2.2 0.55I 53.91 230543158 28.68 30.85 28.33 31.19 Displacement . -l.8{] 0.12 -13.98 1.062T6E-34I -1.86 -1.40I -1.94I -l.33 Ndschmmny _ 4.05 0.32 12.41 631598329 3.34 4.59 3.14_ 4.29 [ageDlmy _ 1.78 0.29_ 5.60 489555503 1.0? 2.22 0.88 2.41 PremiumDnmmy 4.89 0.2.1 6.36 1.611615-01F -1.53 -0.?l 4.66 4158 Suppose that you want to predict the miles per gallon achieved by an automobile that has a displacement of 4.6, is a Compact in Class and uses Premium fuel. What is the best estimate you can make for miles per gallon achieved by this automobile? (ENTER NUMERICAL VALUE ROUNDED TO TWO DEClMAL POINT VALUES)
Step by Step Solution
There are 3 Steps involved in it

Get step-by-step solutions from verified subject matter experts