

Question: The fallowing graph plots the relationship between risk, calculated as the standard deviation of the return of a stock partiolio, and the number af different
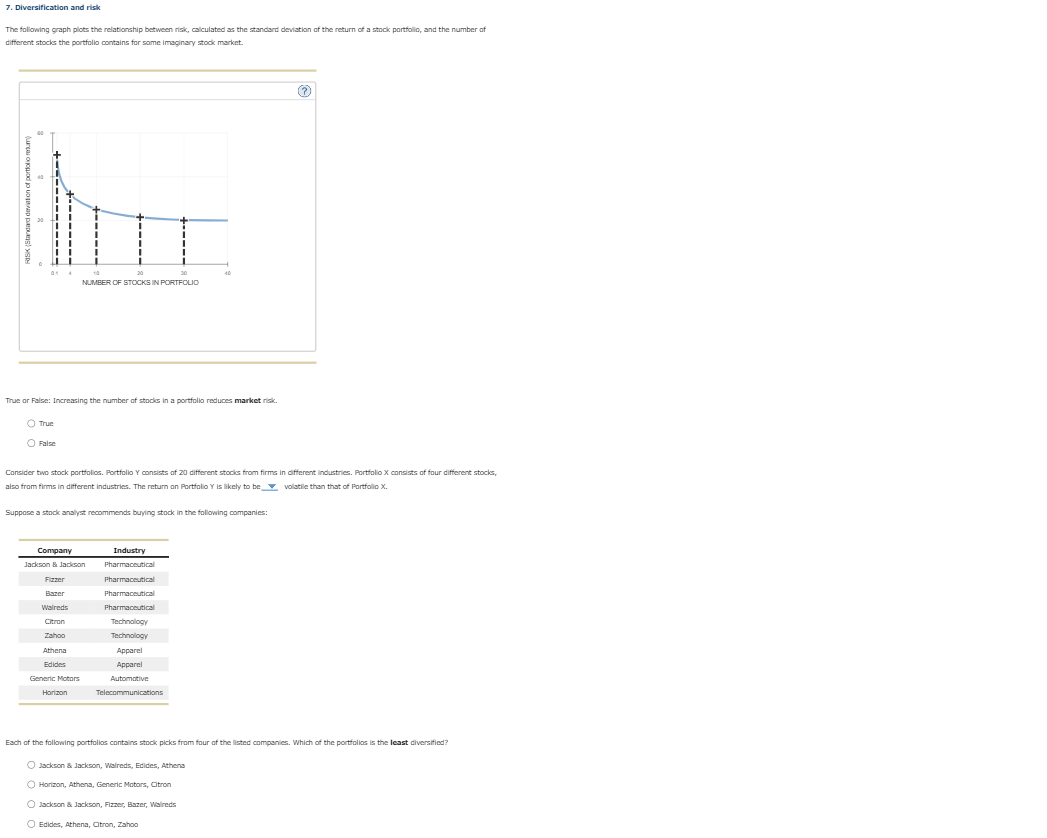
The fallowing graph plots the relationship between risk, calculated as the standard deviation of the return of a stock partiolio, and the number af different stocks the portfolio contains for some imsginary stodk market. True ar False: Increasing the number of stodes in a portfolio roduces market riskc. True False Consider two stock portfalioa. Portfolio Y consists af 20 different stods from firma in different industries. Portfalio X consists of faur different stocks, also fram finms in different industries. The retum an Partfalio Y is likely to be volatile than that of Partfolio x. Suppose a stadk anslyst recommends buying stodk in the fallowing companies: Each of the fallowing portfolios containg stock picks fram faur of the listed companies. Which of the portfoliog is the least diversified? Jackson a Jackson, Wbireds, Edides, Atheng Horizon, Athens, Generic Mators, Qtron Jsckson s Jackson, Fizser, Bszer, Wolreds Edides, Athena, Otron, Zahoo
Step by Step Solution
There are 3 Steps involved in it

Get step-by-step solutions from verified subject matter experts