

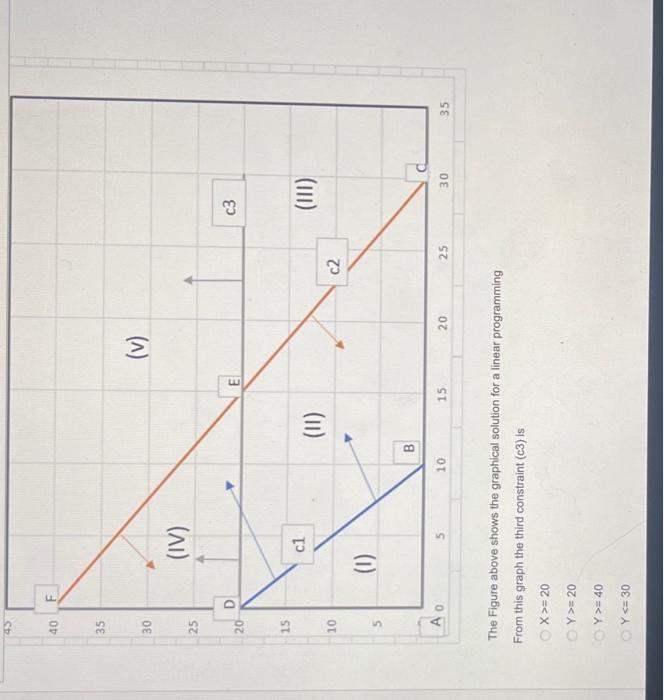
Question: The Figure above shows the graphical solution for a linear programming From this graph the third constraint (c3) is X>=20Y>=20Y>=40Y
Step by Step Solution
There are 3 Steps involved in it
1 Expert Approved Answer
Step: 1 Unlock

Question Has Been Solved by an Expert!
Get step-by-step solutions from verified subject matter experts
Step: 2 Unlock
Step: 3 Unlock