

Question: The figure below is a pivot table that shows the sum of revenue by product. Analyze it and answer questions A and B. Why do
The figure below is a pivot table that shows the sum of revenue by product. Analyze it and answer questions A and B.
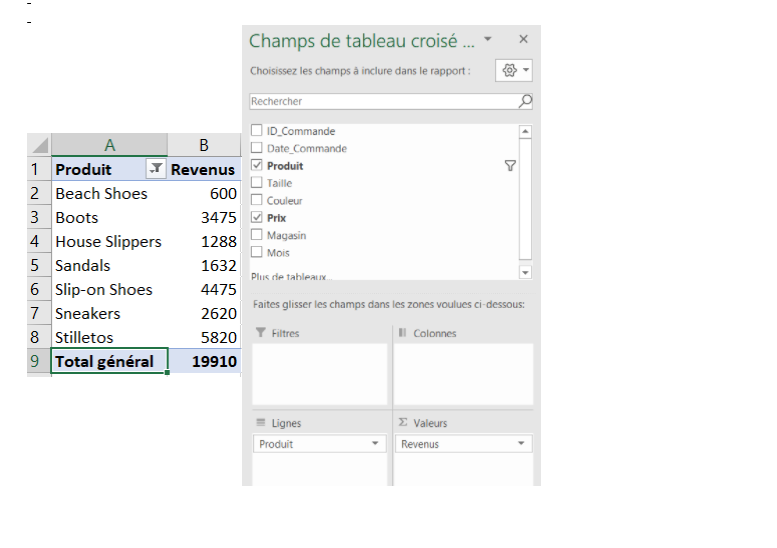
Why do we call this kind of table 'dynamic'? (3 points)
As you could see, the table in the figure above shows the sum of sales by product. Explain the steps in Excel to present the average revenue by product instead of the sum (5 points
Champs de tableau crois... Choisissez les champs inclure dans le rapport: Rechercher A 1 Produit 2 Beach Shoes 3 Boots 4 House Slippers 5 Sandals 6 Slip-on Shoes 7 Sneakers 8 Stilletos 9 Total gnral ID Commande B Date_Commande Revenus Produit Y Taille 600 Couleur 3475 Prix 1288 Magasin Mois 1632 Plus de tableaux 4475 Faites glisser les champs dans les zones voulues ci-dessous: 2620 5820 7 Filtres Il Colonnes 19910 Lignes Produit Valeurs RevenusStep by Step Solution
There are 3 Steps involved in it
1 Expert Approved Answer
Step: 1 Unlock

Question Has Been Solved by an Expert!
Get step-by-step solutions from verified subject matter experts
Step: 2 Unlock
Step: 3 Unlock