

Question: The figure below shows the demand curve for a U.S. farmer for irrigating his land. It costs $100 per acre to irrigate the land.
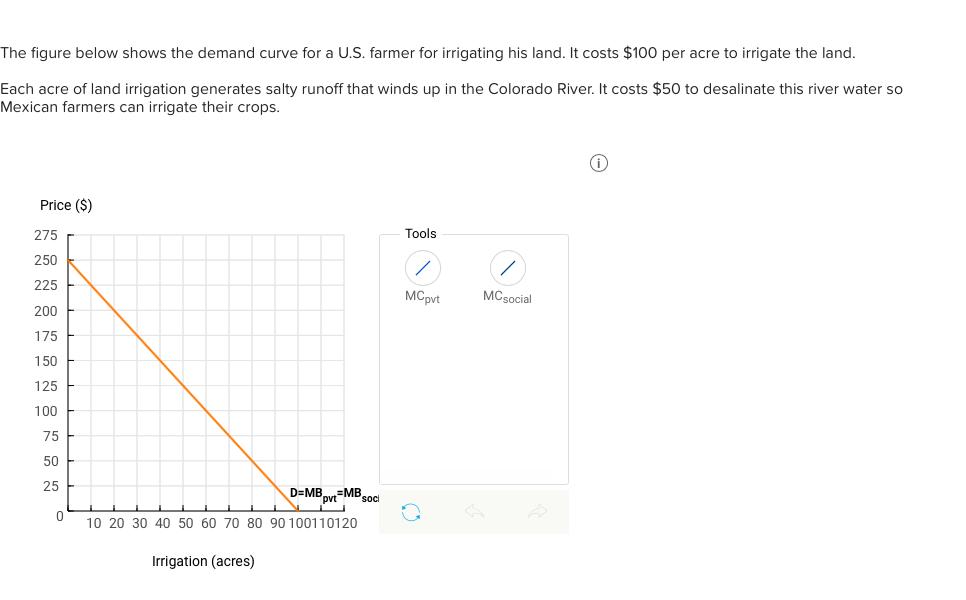
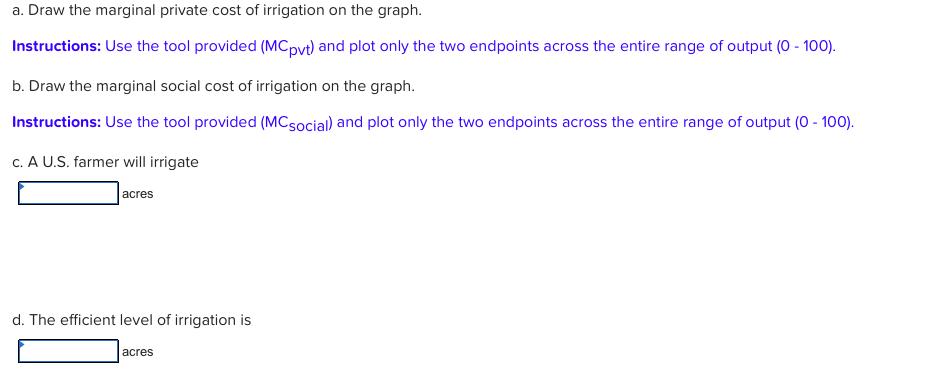
The figure below shows the demand curve for a U.S. farmer for irrigating his land. It costs $100 per acre to irrigate the land. Each acre of land irrigation generates salty runoff that winds up in the Colorado River. It costs $50 to desalinate this river water so Mexican farmers can irrigate their crops. Price ($) 275 Tools 250 225 MCpvt MCsocial 200 175 150 125 100 75 50 25 D=MBv=MBsod 10 20 30 40 50 60 70 80 90 100110120 Irrigation (acres) a. Draw the marginal private cost of irrigation on the graph. Instructions: Use the tool provided (MCpvt) and plot only the two endpoints across the entire range of output (0 - 100). b. Draw the marginal social cost of irrigation on the graph. Instructions: Use the tool provided (MCsocial) and plot only the two endpoints across the entire range of output (0 - 100). C. A U.S. farmer will irrigate acres d. The efficient level of irrigation is acres
Step by Step Solution
3.38 Rating (154 Votes )
There are 3 Steps involved in it
a The cost per unit is constant means the MC private ... View full answer

Get step-by-step solutions from verified subject matter experts