

Question: The figure below shows the level curves of a function f(x,y) around a maximum or minimum, M. The z- and y-axes are along the
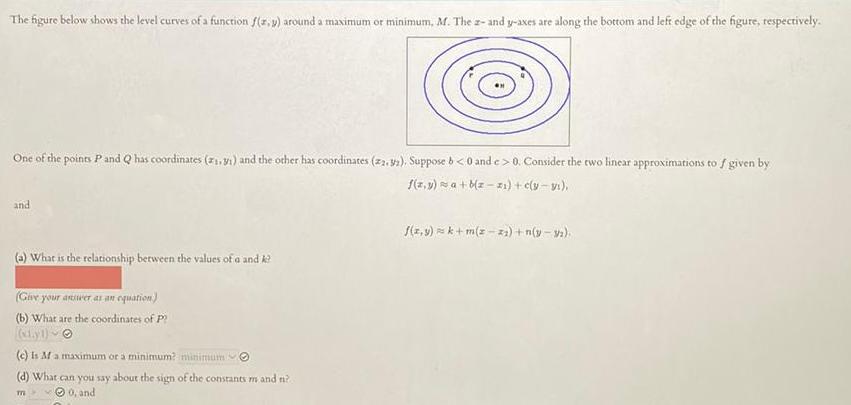
The figure below shows the level curves of a function f(x,y) around a maximum or minimum, M. The z- and y-axes are along the bottom and left edge of the figure, respectively. One of the points P and Q has coordinates (1,31) and the other has coordinates (22. y2). Suppose b < 0 and e> 0. Consider the two linear approximations to f given by f(x,y) = a + b(-1)+c(y-1), and f(x,y) k+m(-2)+n(y-3) (a) What is the relationship between the values of a and k? (Give your answer as an equation) (b) What are the coordinates of P (cyl)- (c) is M a maximum or a minimum? minimum (d) What can you say about the sign of the constants m and n? m 0, and
Step by Step Solution
There are 3 Steps involved in it

Get step-by-step solutions from verified subject matter experts