

Question: The figure includes annual flow duration curves based on the daily mean flows during the 2 0 0 1 water year ( WY 2 0
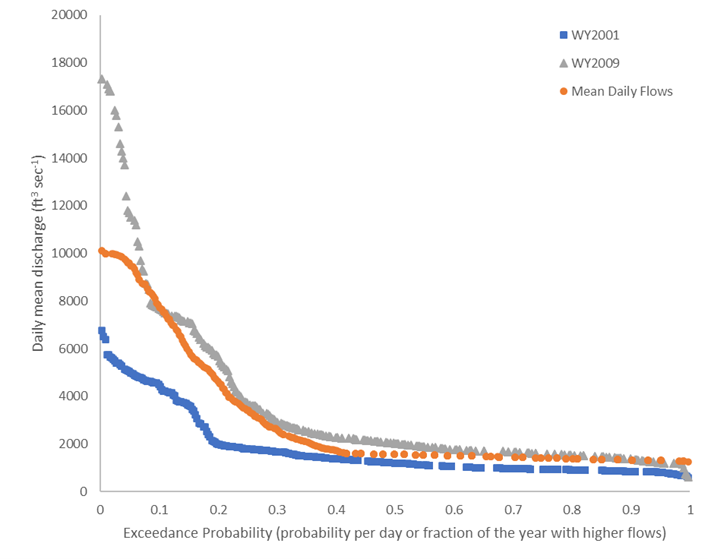
The figure includes annual flow duration curves based on the daily mean flows during the water year WY in blue squares and the water year WY in grey triangles for the Upper Clark Fork River gauge upstream from Missoula gauge number The annual flow duration curve based on the mean daily flows year period of record at the same gauge is also provided.
a For each of the and water years, please provide the value for daily mean discharge that was exceeded of the year I would like a discharge value for each year approximated from the graph. Based on comparison with statistics calculated over the year period of record, are each of these flows higher than, lower than, or similar to what would be considered typical at the exceedance probability? Please describe how you are interpreting the graph to answer this question.
b Based on daily mean flows with exceedance probabilities between and which of the or water years generally sustained higher discharges during annual low flow conditions? Based on comparison with statistics calculated over the year period of record, which of these water years had more typical levels of sustained discharge during annual low flow conditions? Please describe how you are interpreting the graph to answer this question.
You are examining a record of annual peak flows for a different gauge that includes years of data from water years A flood in the spring of resulted in an annual peak flow of ms
c When ranked from highest to lowest discharge, the annual peak flow of ms in was the th highest on record. For a flood frequency analysis, calculate the exceedance probability and return interval of the annual peak flow.
A flow of m s is also the upper threshold above which flows are expected to damage the abutments on a bridge. You are asked to summarize the potential for flood damage to this bridge based on historical data in the period of record. You are provided a constraint on a risk assessment that the probability of flood damage to the bridge at least once over a year period must be less than or less than an chance
d Would the bridge need to be redesigned to meet the stated tolerance of risk? Show your work for the yr aggregate probability you calculated and describe why you answered yes or no
Step by Step Solution
There are 3 Steps involved in it
1 Expert Approved Answer
Step: 1 Unlock

Question Has Been Solved by an Expert!
Get step-by-step solutions from verified subject matter experts
Step: 2 Unlock
Step: 3 Unlock