

Question: The figure shows that ... comparative advantages are determined by relative employment. absolute advantages are determined by relative productivities. absolute advantages are determined by
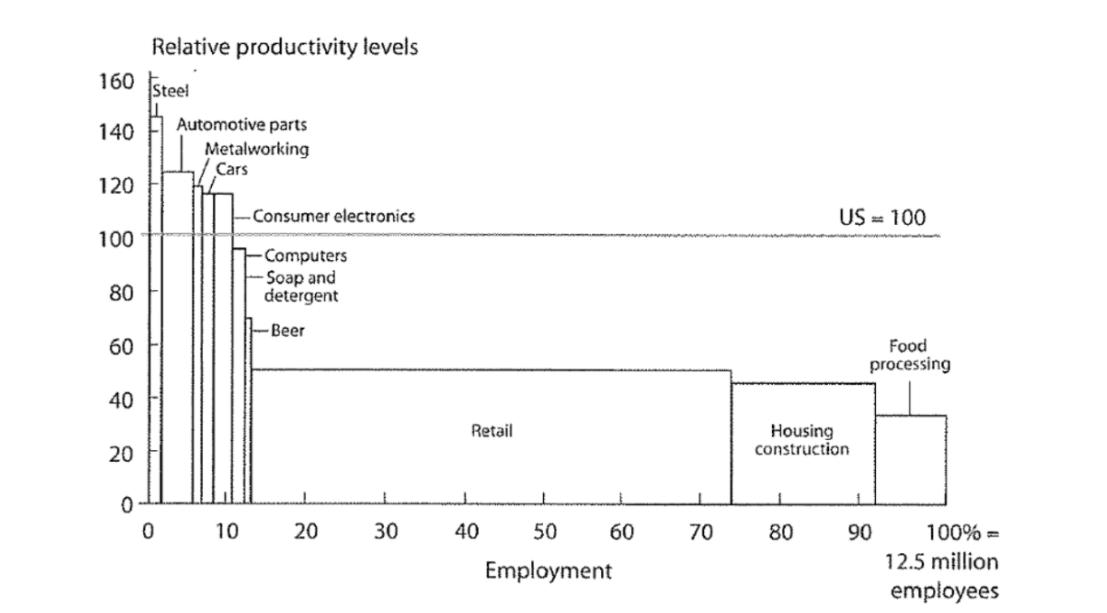
The figure shows that ... comparative advantages are determined by relative employment. absolute advantages are determined by relative productivities. absolute advantages are determined by relative employment. comparative advantages are determined by relative productivities. 160 Steel 140 120 100 80 60 40 20 Relative productivity levels 0 0 Automotive parts Metalworking Cars 10 -Consumer electronics -Computers -Soap and detergent Beer 20 30 Retail 40 50 Employment 60 70 Housing construction 1 US = 100 80 Food processing 90 100% = 12.5 million employees
Step by Step Solution
3.46 Rating (149 Votes )
There are 3 Steps involved in it
The detailed answer for the above question is provided below An... View full answer

Get step-by-step solutions from verified subject matter experts