

Question: The figures below show statements of analyzing data, each statement corresponds to one of the symbols of flowchart. 1) SKETCH each statement to a
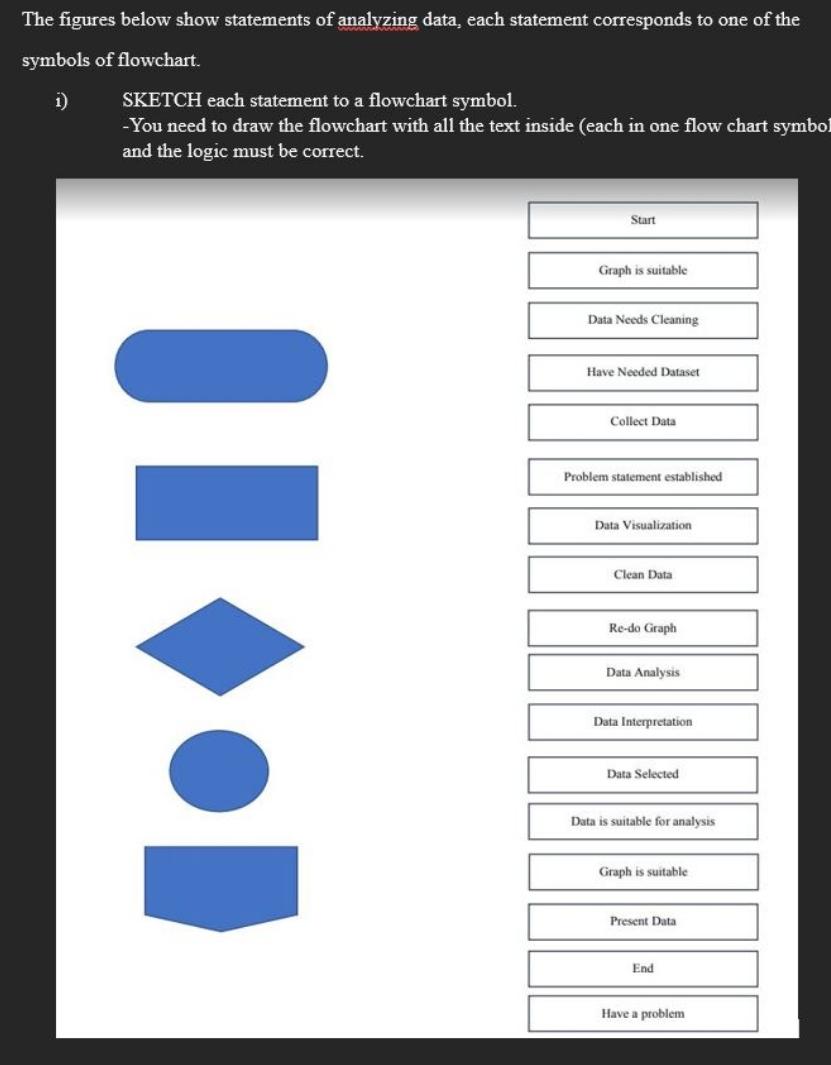
The figures below show statements of analyzing data, each statement corresponds to one of the symbols of flowchart. 1) SKETCH each statement to a flowchart symbol. -You need to draw the flowchart with all the text inside (each in one flow chart symbol and the logic must be correct. Start Graph is suitable Data Needs Cleaning Have Needed Dataset Collect Data Problem statement established Data Visualization Clean Data Re-do Graph Data Analysis Data Interpretation Data Selected Data is suitable for analysis Graph is suitable Present Data End Have a problem
Step by Step Solution
There are 3 Steps involved in it
1 Expert Approved Answer
Step: 1 Unlock

Question Has Been Solved by an Expert!
Get step-by-step solutions from verified subject matter experts
Step: 2 Unlock
Step: 3 Unlock