

Question: the first picture shouldnt be here CASE STUDY QUESTIONS | 12-13 How is GE changing its business Strategy and business model? What is the role
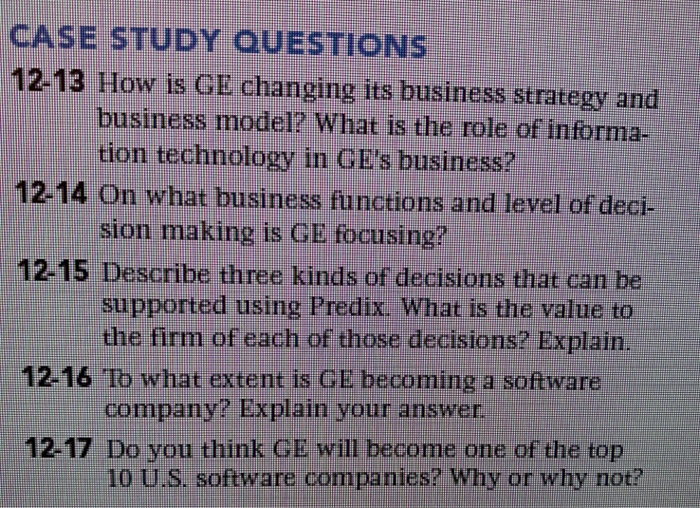
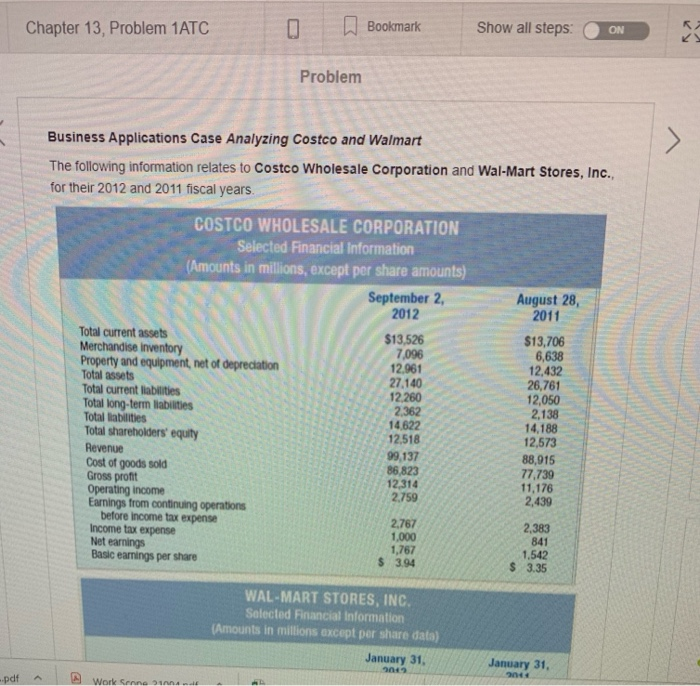
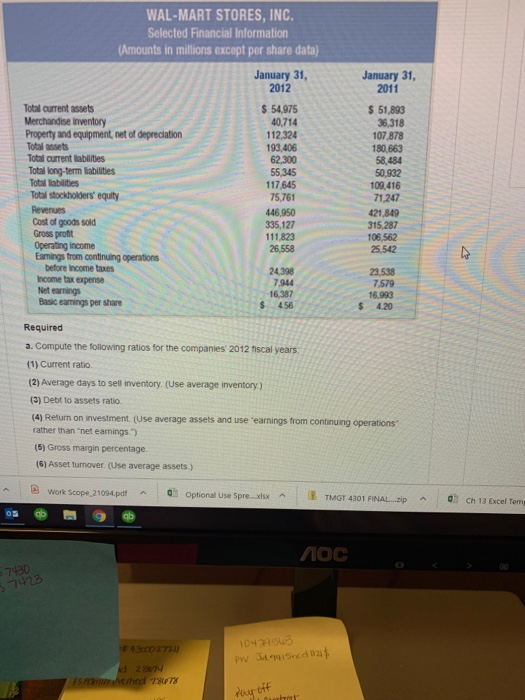
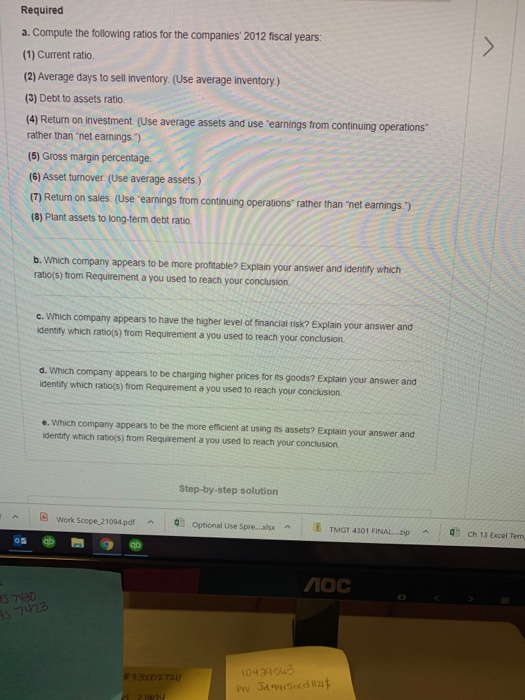
CASE STUDY QUESTIONS | 12-13 How is GE changing its business Strategy and business model? What is the role of informa- tion technology in GE's business? | 12-14 On what business functions and level of deci- sion making is CE focusing? 12-15 Describe three kinds of decisions that can be supported using Predix. What is the value to the firm of each of those decisions? Explain. 12-16 Io what extent is GE becoming a software company? Explain your answer. Do you think GE will become one of the top 10 U.S. software companies? Why or why not? Chapter 13, Problem 1ATC Bookmark Show all steps: ON Problem Business Applications Case Analyzing Costco and Walmart The following information relates to Costco Wholesale Corporation and Wal-Mart Stores, Inc. for their 2012 and 2011 fiscal years. August 28, 2011 COSTCO WHOLESALE CORPORATION Selected Financial Information (Amounts in millions, except per share amounts) September 2, 2012 Total current assets $13,526 Merchandise Inventory 7,096 Property and equipment, net of depreciation 12,961 Total assets 27,140 Total current liabilities 12,260 Total long-term liabilities 2,362 Total liabilities 14,622 Total shareholders' equity 12,518 Revenue 99,137 Cost of goods sold 86,823 Gross profit 12,314 Operating income 2.759 Earnings from continuing operations before income tax expense 2,767 Income tax expense 1,000 Net earnings 1,767 Basic earnings per share $ 3.94 $13,706 6,638 12,432 26,761 12,050 2,138 14,188 12,573 88,915 77,739 11,176 2,439 2,383 841 1,542 3.35 $ WAL-MART STORES, INC. Selected Financial Information (Amounts in millions except per share data) January 31, January 31, .pdf A Work Senne WAL-MART STORES, INC. Selected Financial Information (Amounts in millions except per share data) January 31, 2012 January 31, 2011 Total current assets Merchandise inventory Property and equipment, net of depreciation Total assets Total current liabilities Total long-term liabilities Total liabilities Total stockholders' equity Revenues Cost of goods sold Gross profit Operating income Earnings from continuing operations before income taxes Income tax expense Net earnings Basic earnings per share $ 54,975 40,714 112,324 193,406 62,300 55,345 117,645 75,761 446,950 335,127 111823 26,558 $ 51,893 36.318 107,878 180.663 58,484 50,932 109,416 71.247 421,849 315,287 106,562 25,542 24.398 7.944 16.387 456 23.538 7,579 16.993 $ Required a. Compute the following ratios for the companies 2012 fiscal years (1) Current ratio. (2) Average days to sell inventory (Use average inventory.) (3) Debt to assets ratio. (4) Return on investment (Use average assets and use earnings from continuing operations rather than "net eamings) (5) Gross margin percentage (6) Asset turnover (Use average assets.) Work Scope 21094.pdf 0 Optional Use Spre_xlsx T MGT 4301 FINAL... p a Ch 13 Dicel Temg 100 7430 57423 43000272.0) 10424543 PW JA 9415 ned 1120$ FS h 220 ed 28678 bat Required a. Compute the following ratios for the companies' 2012 fiscal years: (1) Current ratio (2) Average days to sell inventory. (Use average inventory.) (3) Debt to assets ratio (4) Return on investment (Use average assets and use earnings from continuing operations rather than 'net eamings.") (5) Gross margin percentage (6) Asset turnover. (Use average assets.) (7) Return on sales. (Use earnings from continuing operations rather than "net earnings." (8) Plant assets to long-term debt ratio. b. Which company appears to be more profitable? Explain your answer and identify which ratio(s) from Requirement a you used to reach your conclusion C. Which company appears to have the higher level of financial risk? Explain your answer and identity which ratio(s) from Requirement a you used to reach your conclusion d. Which company appears to be charging higher prices for its goods? Explain your answer and identity which ratio(s) from Requirement a you used to reach your conclusion e. Which company appears to be the more efficient at using its assets? Explain your answer and identify which ratio(s) from Requirement a you used to reach your conclusion Step-by-step solution Work Scope 21094.pdf 0 Optional Use Spre... TMGT 4301 FINAL. Ch 13 Excel Te 4272 1042103 PN Jaquisneduzir CASE STUDY QUESTIONS | 12-13 How is GE changing its business Strategy and business model? What is the role of informa- tion technology in GE's business? | 12-14 On what business functions and level of deci- sion making is CE focusing? 12-15 Describe three kinds of decisions that can be supported using Predix. What is the value to the firm of each of those decisions? Explain. 12-16 Io what extent is GE becoming a software company? Explain your answer. Do you think GE will become one of the top 10 U.S. software companies? Why or why not? Chapter 13, Problem 1ATC Bookmark Show all steps: ON Problem Business Applications Case Analyzing Costco and Walmart The following information relates to Costco Wholesale Corporation and Wal-Mart Stores, Inc. for their 2012 and 2011 fiscal years. August 28, 2011 COSTCO WHOLESALE CORPORATION Selected Financial Information (Amounts in millions, except per share amounts) September 2, 2012 Total current assets $13,526 Merchandise Inventory 7,096 Property and equipment, net of depreciation 12,961 Total assets 27,140 Total current liabilities 12,260 Total long-term liabilities 2,362 Total liabilities 14,622 Total shareholders' equity 12,518 Revenue 99,137 Cost of goods sold 86,823 Gross profit 12,314 Operating income 2.759 Earnings from continuing operations before income tax expense 2,767 Income tax expense 1,000 Net earnings 1,767 Basic earnings per share $ 3.94 $13,706 6,638 12,432 26,761 12,050 2,138 14,188 12,573 88,915 77,739 11,176 2,439 2,383 841 1,542 3.35 $ WAL-MART STORES, INC. Selected Financial Information (Amounts in millions except per share data) January 31, January 31, .pdf A Work Senne WAL-MART STORES, INC. Selected Financial Information (Amounts in millions except per share data) January 31, 2012 January 31, 2011 Total current assets Merchandise inventory Property and equipment, net of depreciation Total assets Total current liabilities Total long-term liabilities Total liabilities Total stockholders' equity Revenues Cost of goods sold Gross profit Operating income Earnings from continuing operations before income taxes Income tax expense Net earnings Basic earnings per share $ 54,975 40,714 112,324 193,406 62,300 55,345 117,645 75,761 446,950 335,127 111823 26,558 $ 51,893 36.318 107,878 180.663 58,484 50,932 109,416 71.247 421,849 315,287 106,562 25,542 24.398 7.944 16.387 456 23.538 7,579 16.993 $ Required a. Compute the following ratios for the companies 2012 fiscal years (1) Current ratio. (2) Average days to sell inventory (Use average inventory.) (3) Debt to assets ratio. (4) Return on investment (Use average assets and use earnings from continuing operations rather than "net eamings) (5) Gross margin percentage (6) Asset turnover (Use average assets.) Work Scope 21094.pdf 0 Optional Use Spre_xlsx T MGT 4301 FINAL... p a Ch 13 Dicel Temg 100 7430 57423 43000272.0) 10424543 PW JA 9415 ned 1120$ FS h 220 ed 28678 bat Required a. Compute the following ratios for the companies' 2012 fiscal years: (1) Current ratio (2) Average days to sell inventory. (Use average inventory.) (3) Debt to assets ratio (4) Return on investment (Use average assets and use earnings from continuing operations rather than 'net eamings.") (5) Gross margin percentage (6) Asset turnover. (Use average assets.) (7) Return on sales. (Use earnings from continuing operations rather than "net earnings." (8) Plant assets to long-term debt ratio. b. Which company appears to be more profitable? Explain your answer and identify which ratio(s) from Requirement a you used to reach your conclusion C. Which company appears to have the higher level of financial risk? Explain your answer and identity which ratio(s) from Requirement a you used to reach your conclusion d. Which company appears to be charging higher prices for its goods? Explain your answer and identity which ratio(s) from Requirement a you used to reach your conclusion e. Which company appears to be the more efficient at using its assets? Explain your answer and identify which ratio(s) from Requirement a you used to reach your conclusion Step-by-step solution Work Scope 21094.pdf 0 Optional Use Spre... TMGT 4301 FINAL. Ch 13 Excel Te 4272 1042103 PN Jaquisneduzir
Step by Step Solution
There are 3 Steps involved in it

Get step-by-step solutions from verified subject matter experts