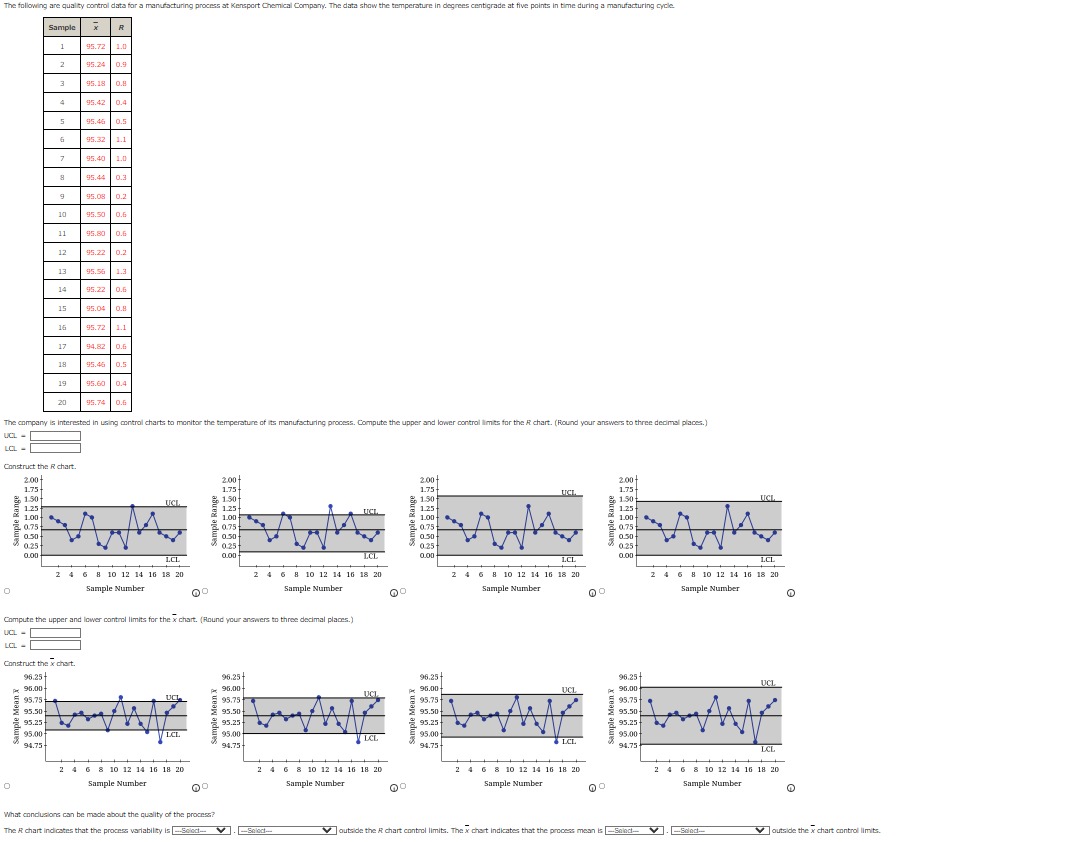
Question: The following are quality control data for a manufacturing process at Kensport Chemical Company. The data show the temperature in degrees centigrade at five points

The following are quality control data for aThe following are quality control data for a

The following are quality control data for a manufacturing process at Kensport Chemical Company. The data show the temperature in degrees centigrade at five points in time during a manufacturing cycle Sample R 1 1 95.72 1.0 2 95.240.9 3 95.18 0.8 4 95.42 0.4 5 95.46 0.5 5 95.32 1.1 7 95.40 1.0 95.44 0.3 95.44 9 95.08 0.2 10 95.50 0.5 11 95.80 0.6 12 95.22 0.2 13 95.5613 14 95.22 0.5 15 95.04 0.8 16 95.72 1.1 17 94.82 0.6 18 95.46 0.5 19 95.60 0.4 20 95.740.6 The company is interested in using contrail charts to monitor the temperature of its manufacturing process. Compute the upper and lower controllimits for the chart. (Round your answers to three decimal places.) UCL - LOL - 2.00+ TICI UCL TUCA Construct the chart. 2.00 1.75 1.50 S 1.25 1.00 0.75 0.50 025 0.00 TEC 2.00 1.75 1.50 1.25+ 1.00 0.75 0.50 0.25 0.00 1.75 1.50 1.25 2 1.00 0.75 0.50 0.25 0.00 2007 1.75+ 1.50 1.23 1.00 0.75 0.50 025 0.00 M 1.CL 1.CL 2 4 6 8 10 12 14 16 18 20 Sample Number 2 4 6 8 10 12 14 16 18 20 Sample Number 2 4 6 8 10 12 14 16 18 20 Sample Number 1.CL 2 4 6 8 10 12 14 16 18 20 Sample Number O 0 O Compute the upper and lower control limits for the x chart. (Round your answers to three decimal places.) UCL - LOL - UCL UCI UCL Construct the x chart. 96.25 + 96.00+ 95.75 95.50 + 95.25 95.00 94.75 96.25 + 96.00 95.75 95.50 + 95.25 95.00 94.75 96.25 + 95.00 95.75 95.50 95.25 95.00 94.75 A V 96.257 95.00 95.75 95.50 + 95.25 from the her TCL LCL 95.00 LCL 94.75 LCL 2 4 6 8 10 12 14 16 18 20 Sample Number 2 4 6 8 10 12 14 16 18 20 Sample Number 2 4 6 8 10 12 14 16 18 20 Sample Number 2 4 6 8 10 12 14 16 18 20 Sample Number 00 What conclusions can be made about the quality of the procesz? The R chart indicates that the proces variability is --Select- V. Solo Select Voutside the chart controllimits. The x chart indicates that the process means --- Select -Selo outside the x chart controllimits. FACTORS FOR 7 AND R CONTROL CHARTS D3 Observations in Sample, n 2 3 4 cm in A2 1.880 1.023 0.729 0.577 dz 0.853 0.888 0.880 0.864 0 0 0 0 D 3.267 2.574 2.282 2.114 d, 1.128 1.693 2.059 2.326 2.534 2.704 2.847 2.970 3.078 6 7 8 9 10 0.483 0.419 0.373 0.337 0.308 0.848 0.833 0.820 0.808 0.797 0 0.076 0.136 0.184 0.223 2.004 1.924 1.864 1.816 1.777 11 12 13 14 15 3.173 3.258 3.336 3.407 3.472 0.285 0.266 0.249 0.235 0.223 0.787 0.778 0.770 0.763 0.756 0.256 0.283 0.307 0.328 0.347 1.744 1.717 1.693 1.672 1.653 16 17 18 19 20 3.532 3.588 3.640 3.689 3.735 0.212 0.203 0.194 0.187 0.180 0.750 0.744 0.739 0.734 0.729 0.363 0.378 0.391 0.403 0.415 1.637 1.622 1.608 1.597 1.585 21 22 23 24 25 3.778 3.819 3.858 3.895 3.931 0.173 0.167 0.162 0.157 0.153 0.724 0.720 0.716 0.712 0.708 0.425 0.434 0.443 0.451 0.459 1.575 1.566 1.557 1.548 1.541

Step by Step Solution

There are 3 Steps involved in it

1 Expert Approved Answer
Step: 1 Unlock blur-text-image
Question Has Been Solved by an Expert!

Get step-by-step solutions from verified subject matter experts

Step: 2 Unlock
Step: 3 Unlock

Students Have Also Explored These Related General Management Questions!