

Question: The following data table shows the historical data for the first semester 2020, of the amount of sales of the company IRC, which sells sneakers.
The following data table shows the historical data for the first semester 2020, of the amount of sales of the company "IRC", which sells sneakers.
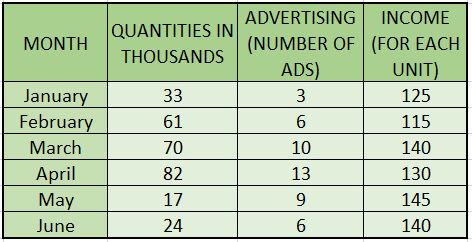
Utilizing multiple lineal regression find an equation that estimates the number of sneakers sold by the company, based on advertising and revenue. Also, determine the standard error of estimation, the coefficient of determination, and the correlation coefficient. Write down what was the quantity in thousands sold in July if the amount of ads was 8 and the income for each unit was $135
\begin{tabular}{|c|c|c|c|} \hline MONTH & QUANTITIESINTHOUSANDS & ADVERTISING(NUMBEROFADS) & INCOME(FOREACHUNIT) \\ \hline January & 33 & 3 & 125 \\ \hline February & 61 & 6 & 115 \\ \hline March & 70 & 10 & 140 \\ \hline April & 82 & 13 & 130 \\ \hline May & 17 & 9 & 145 \\ \hline June & 24 & 6 & 140 \\ \hline \end{tabular}
Step by Step Solution
There are 3 Steps involved in it

Get step-by-step solutions from verified subject matter experts