

Question: The following data were collected to construct an Xbar chart. Each day for 10 days a sample of n=4 was collected. The process standard deviation
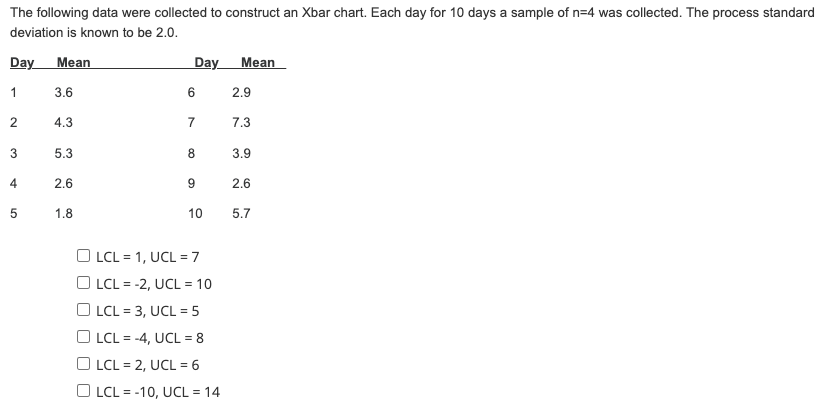
The following data were collected to construct an Xbar chart. Each day for 10 days a sample of n=4 was collected. The process standard deviation is known to be 2.0. LCL=1,UCL=7LCL=2,UCL=10LCL=3,UCL=5LCL=4,UCL=8LCL=2,UCL=6LCL=10,UCL=14
Step by Step Solution
There are 3 Steps involved in it
1 Expert Approved Answer
Step: 1 Unlock

Question Has Been Solved by an Expert!
Get step-by-step solutions from verified subject matter experts
Step: 2 Unlock
Step: 3 Unlock