

Question: The following E ( t ) curves were obtained from a tracer test on two tubular reactors in which dispersion is believed to occur. Figure
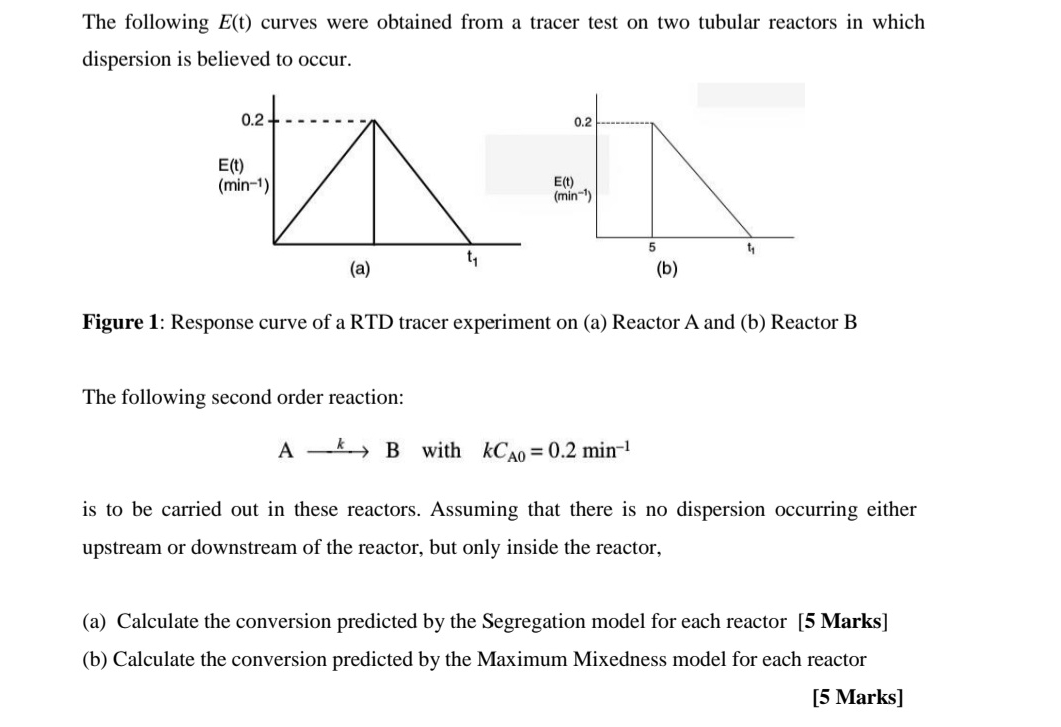
The following curves were obtained from a tracer test on two tubular reactors in which dispersion is believed to occur.
Figure : Response curve of a RTD tracer experiment on a Reactor A and b Reactor B
The following second order reaction:
with
is to be carried out in these reactors. Assuming that there is no dispersion occurring either upstream or downstream of the reactor, but only inside the reactor,
a Calculate the conversion predicted by the Segregation model for each reactor Marks
b Calculate the conversion predicted by the Maximum Mixedness model for each reactor
Marks
Step by Step Solution
There are 3 Steps involved in it
1 Expert Approved Answer
Step: 1 Unlock

Question Has Been Solved by an Expert!
Get step-by-step solutions from verified subject matter experts
Step: 2 Unlock
Step: 3 Unlock