

Question: Figure P 1 7 - 6 B ( a ) RTD reactor A; ( b ) RTD reactor B . What is the mean residence
Figure P B a RTD reactor A; b RTD reactor B
What is the mean residence time, and variance, for the reactor
shown in Figure Pa In Figure P B b
What is the fraction of the fluid that spends minutes or longer in
Figure PB a In Figure PB b
Find the conversion predicted by the segregation model for reactor
Find the conversion predicted by the maximum mixedness model for
reactor
Find the conversion predicted by the TIS model for reactor A
Repeat df for reactor B
Now assume the reaction is first order with what are the
conversions predicted by the tanksinseries, the segregation in the
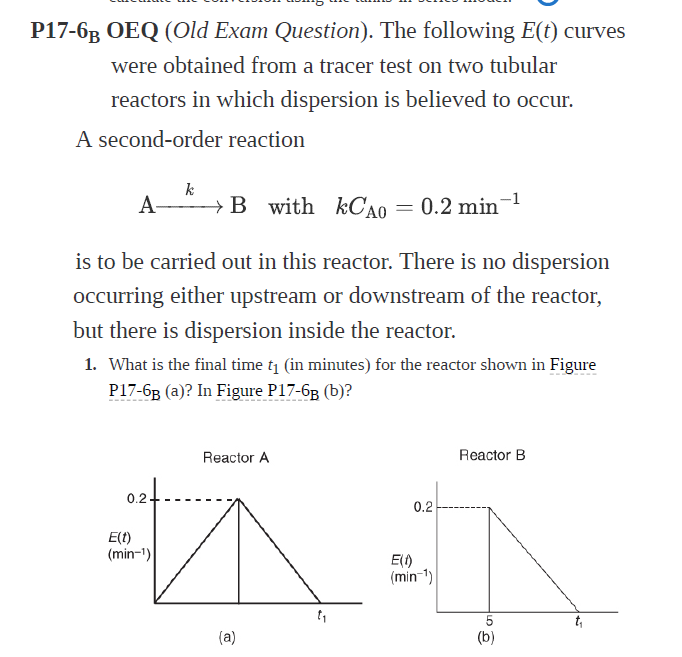
maximum mixedness model? OEQ Old Exam Question The following curves
were obtained from a tracer test on two tubular
reactors in which dispersion is believed to occur.
A secondorder reaction
with min
is to be carried out in this reactor. There is no dispersion
occurring either upstream or downstream of the reactor,
but there is dispersion inside the reactor.
What is the final time in minutes for the reactor shown in Figure
P B a In Figure P B b
Step by Step Solution
There are 3 Steps involved in it
1 Expert Approved Answer
Step: 1 Unlock

Question Has Been Solved by an Expert!
Get step-by-step solutions from verified subject matter experts
Step: 2 Unlock
Step: 3 Unlock