

Question: The following figure shows a Scatter Plot of Sample Data correlation with r = -0.564. How do you qualify this correlation? O a. Weak Correlation
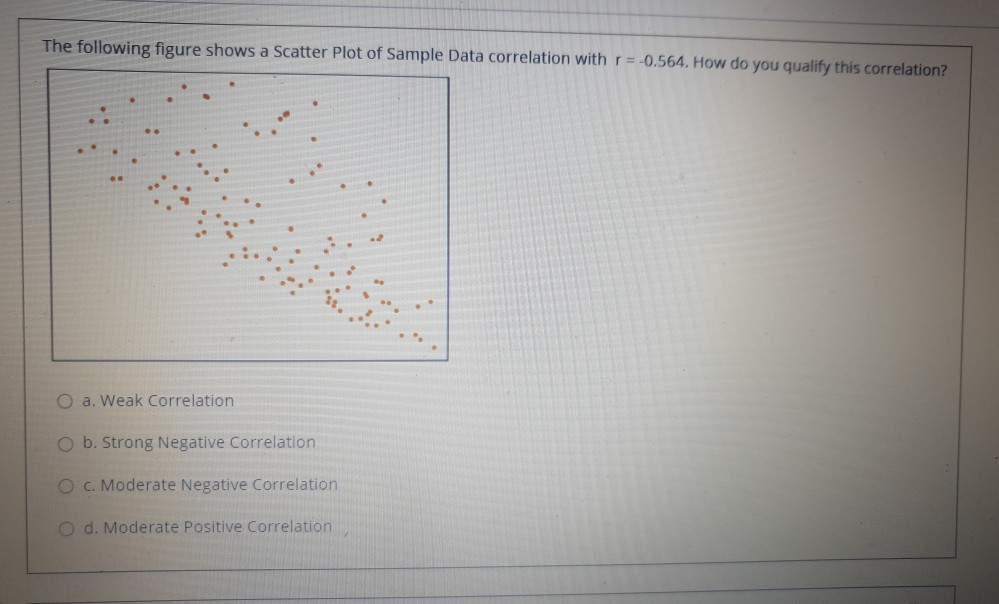
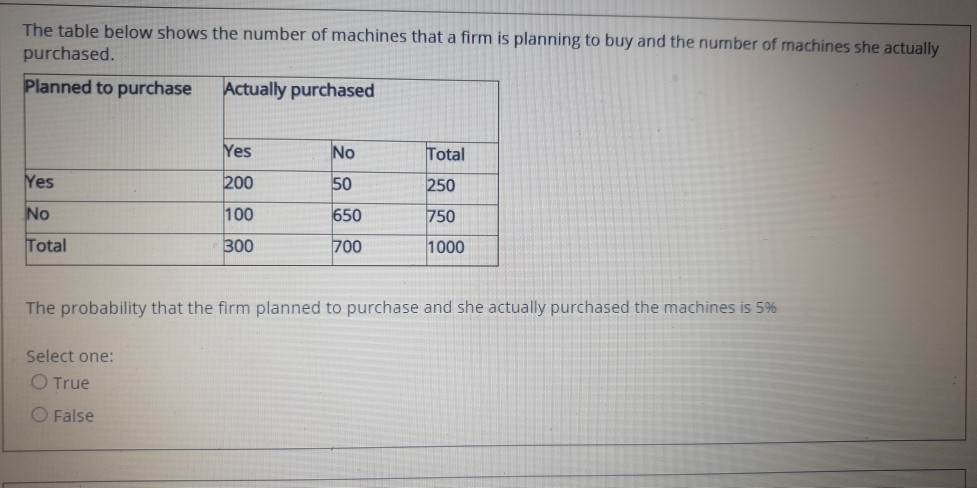
The following figure shows a Scatter Plot of Sample Data correlation with r = -0.564. How do you qualify this correlation? O a. Weak Correlation O b. Strong Negative correlation O c. Moderate Negative correlation O d. Moderate Positive correlation The table below shows the number of machines that a firm is planning to buy and the number of machines she actually purchased. Planned to purchase Actually purchased Yes No Total Yes 200 50 250 No 100 650 750 Total 300 700 1000 The probability that the firm planned to purchase and she actually purchased the machines is 5% Select one: O True O False
Step by Step Solution
There are 3 Steps involved in it
1 Expert Approved Answer
Step: 1 Unlock

Question Has Been Solved by an Expert!
Get step-by-step solutions from verified subject matter experts
Step: 2 Unlock
Step: 3 Unlock