

Question: The following graph shows a decrease in aggregate supply (AS) w a hypothetical economy. Specficallc pregate supply shifts to the leh AS, to AS, causing
The following graph shows a decrease in aggregate supply (AS) w a hypothetical economy. Specficallc pregate supply shifts to the leh AS, to AS, causing the quantity of output suppbed at a price level of 125 to fall from $250 billion to $150
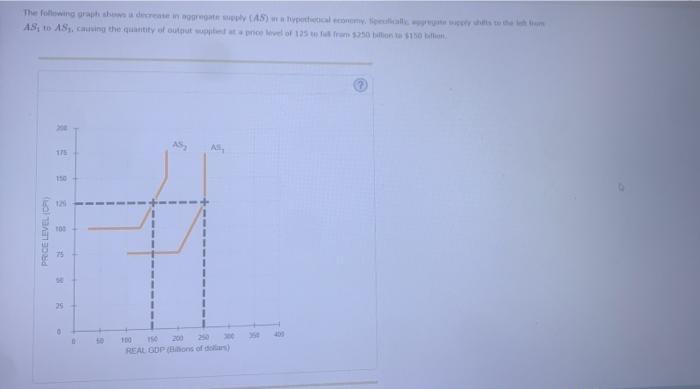
The following graph shows a decrease in aggregate supply (AS) w a hypothetical economy. Specficallc pregate supply shifts to the leh AS, to AS, causing the quantity of output suppbed at a price level of 125 to fall from $250 billion to $150 billion PRICE LEVEL (CPI) 175 110 125 100 75 N 25 0 165 100 150 200 250 300 REAL GDP (Bilions of dollars)
Step by Step Solution
3.28 Rating (157 Votes )
There are 3 Steps involved in it
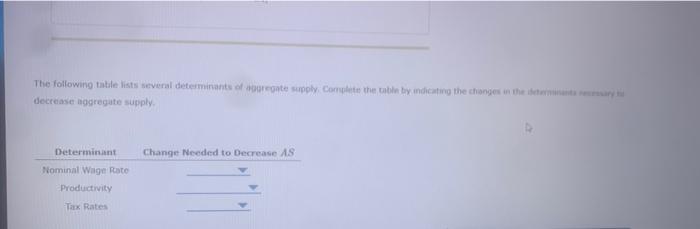
The following table lists several determinants of aggregat... View full answer

Get step-by-step solutions from verified subject matter experts