

Question: The following graph shows the aggregate - demand curve, Shift the aggregate - demand curve on the graph to show the impact of a tax
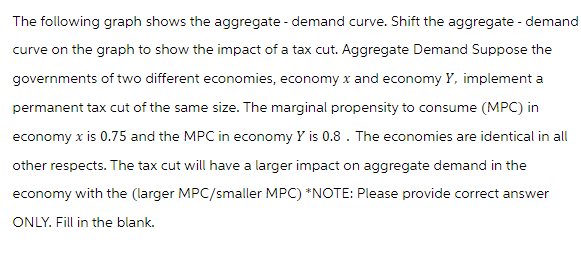
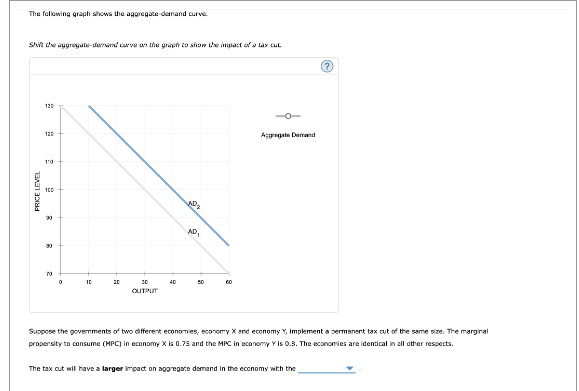
The following graph shows the aggregate - demand curve, Shift the aggregate - demand curve on the graph to show the impact of a tax cut. Aggregate Demand Suppose the governments of two different economies, economy x and economy V. implement a permanent fax cut of the same size. The marginal propensity 1o consume (MPC) in economy x is 0.75 and the MPC in economy is 0.8 . The economies are identical in all other respects. The tax cut will have a larger impact on aggregate demand in the economy with the (larger MPC/smaller MPC) *NOTE: Please provide correct answer QOMLY. Fill in the blank. The following graph shows the aggregate demand curve. Shift the aggregate demand curve on the graph to show the anuact of a tax cut (7) Aggregale Danand PRICE LEVEL AP 40 OLITPUT Suppose the governments of two different economies, economy X and economy Y, implement a permanent tax cut of the same size. The marginal propensity to consume (HPC] in economy X is 0.75 and the MPC in economy Y is 0.5. The economies are identical in all other respects. The tax cut will have a larger Impact on aggregate demand In the economy with the
Step by Step Solution
There are 3 Steps involved in it

Get step-by-step solutions from verified subject matter experts