

Question: The following graph shows the horizontal position as a function of time for a small red cart moving on a track. The horizontal scale is
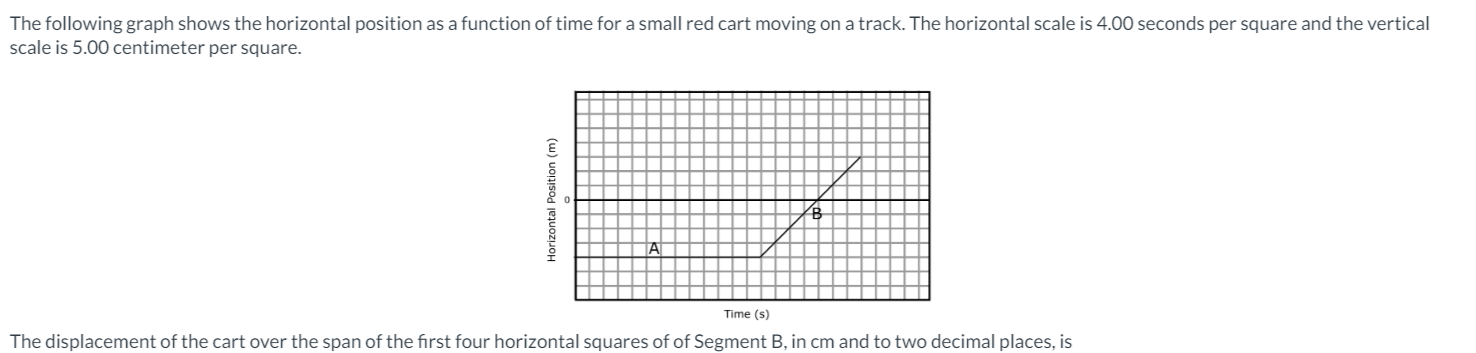
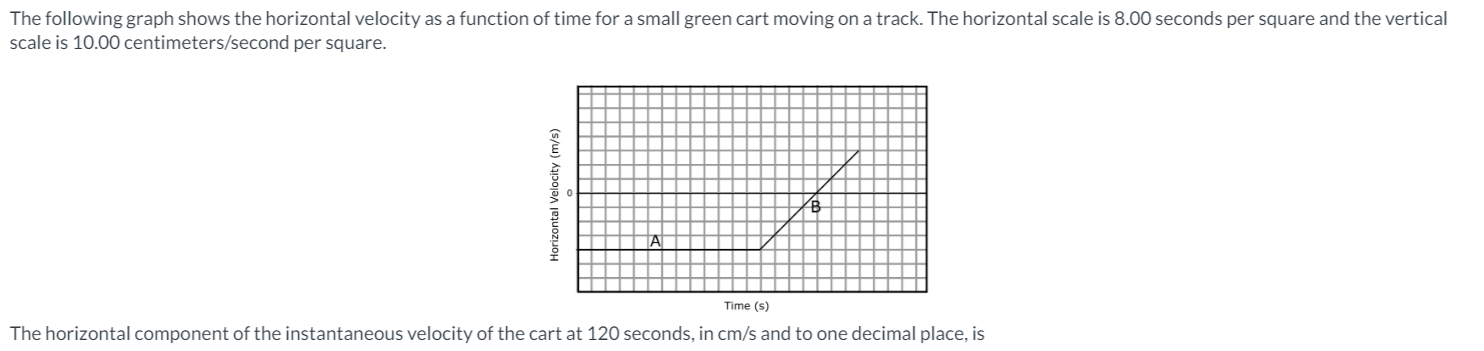
The following graph shows the horizontal position as a function of time for a small red cart moving on a track. The horizontal scale is 4.00 seconds per square and the vertical scale is 5.00 centimeter per square. Horizontal Position (m) Time (s) The displacement of the cart over the span of the first four horizontal squares of of Segment B, in cm and to two decimal places, isThe following graph shows the horizontal velocity as a function of time for a small green cart moving on a track. The horizontal scale is 8.00 seconds per square and the vertical scale is 10.00 centimeters/second per square. Horizontal Velocity (m/s) 0 Time (s) The horizontal component of the instantaneous velocity of the cart at 120 seconds, in cm/s and to one decimal place, is
Step by Step Solution
There are 3 Steps involved in it

Get step-by-step solutions from verified subject matter experts