

Question: The following graph shows the horizontal position as a function of time for a small red cart moving on a track. The horizontal scale is
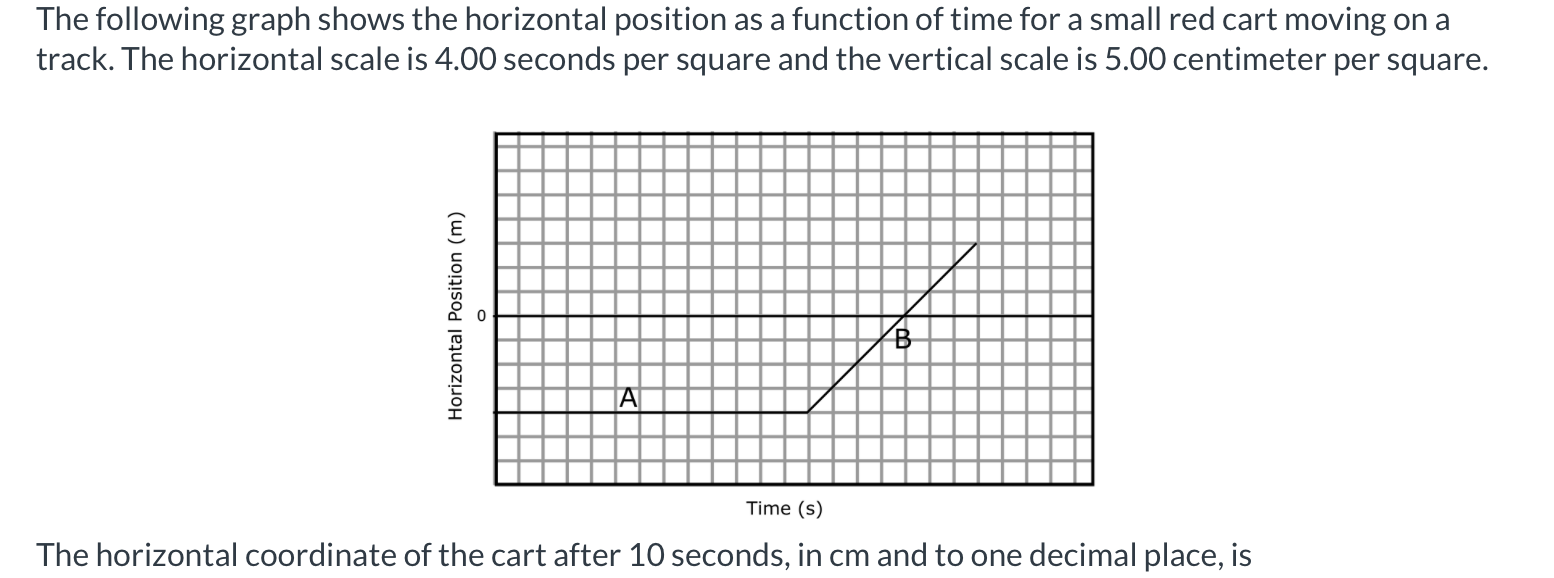
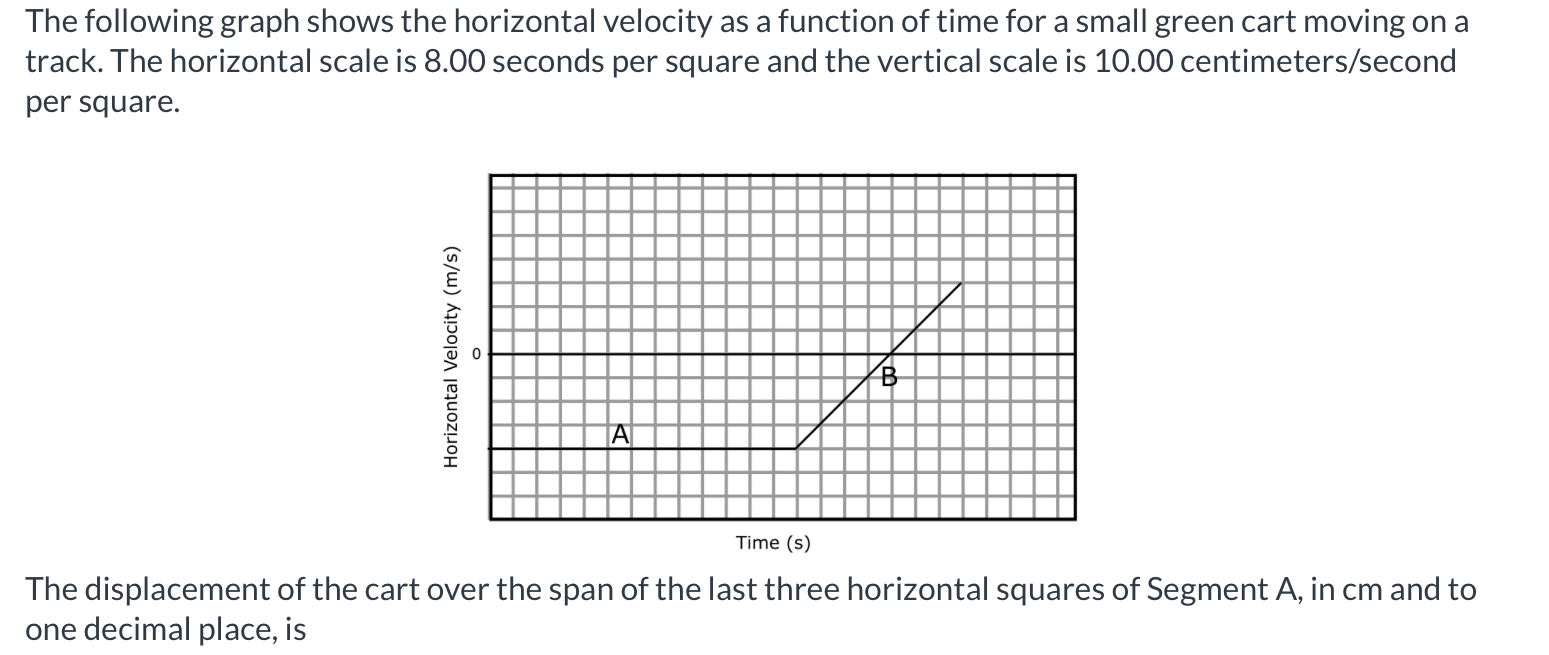
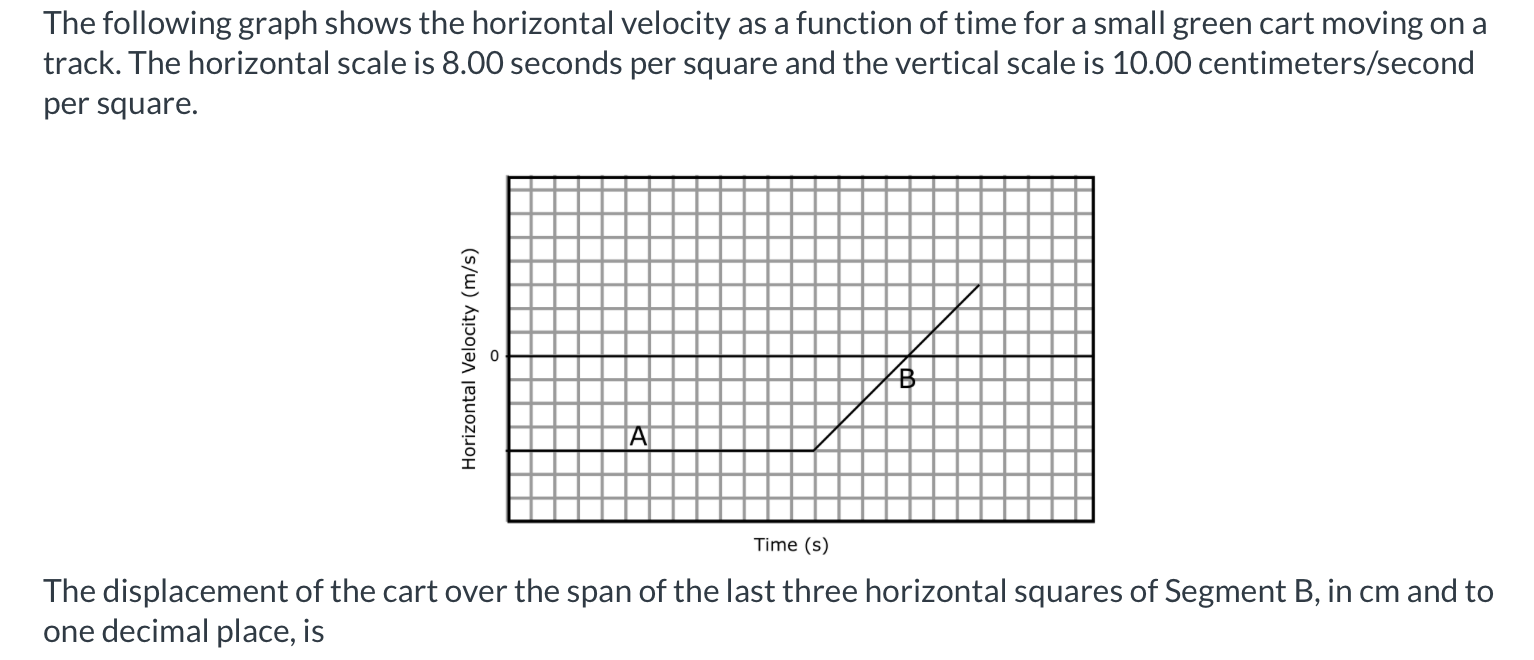
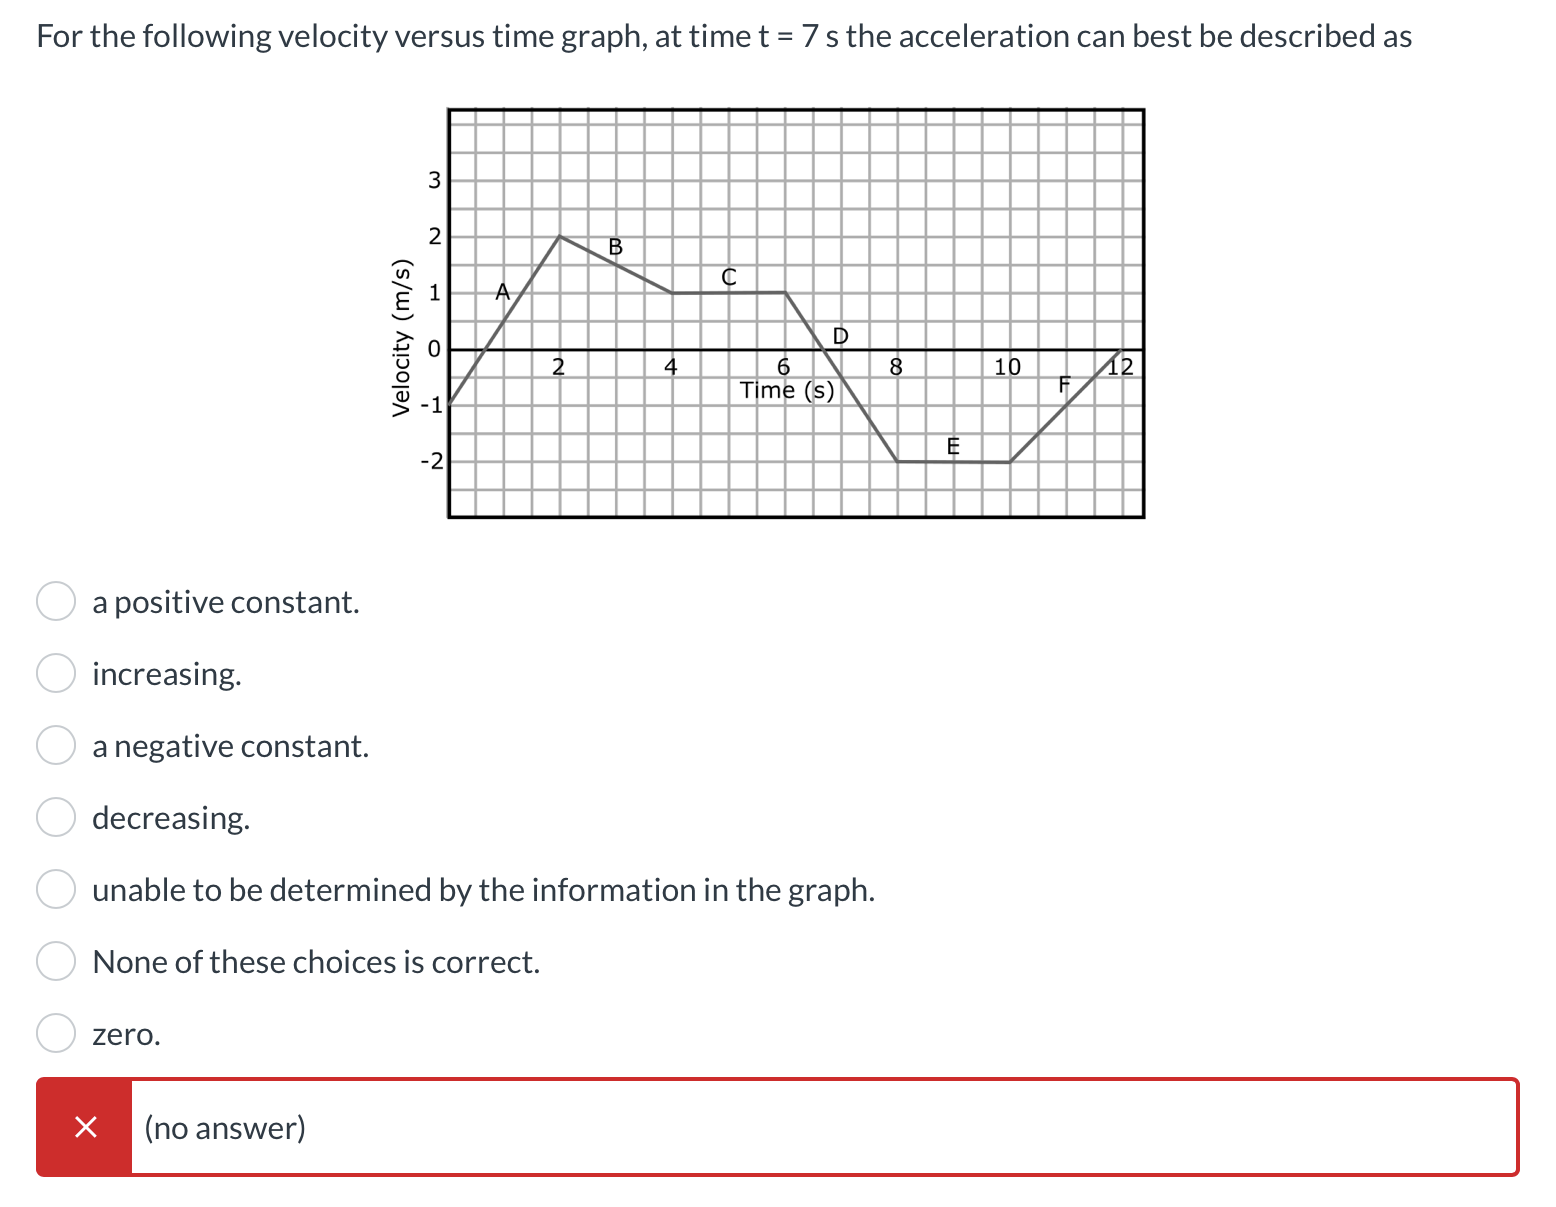
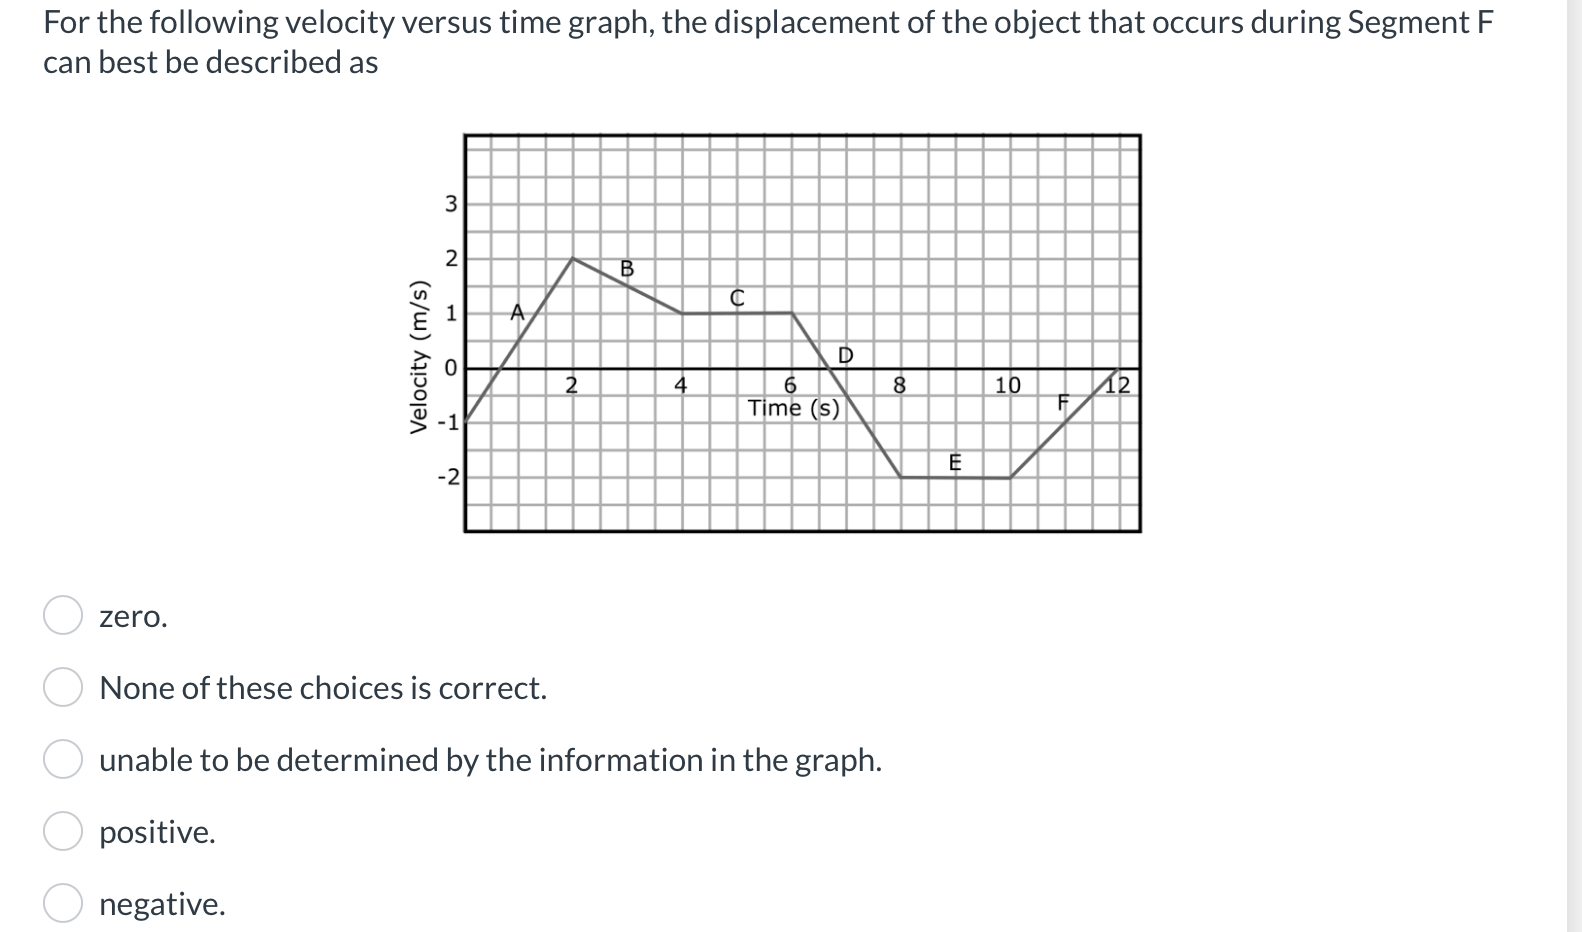
The following graph shows the horizontal position as a function of time for a small red cart moving on a track. The horizontal scale is 4.00 seconds per square and the vertical scale is 5.00 centimeter per square. Horizontal Position (m) 0 A Time (s) The horizontal coordinate of the cart after 10 seconds, in cm and to one decimal place, isThe following graph shows the horizontal velocity as a function of time for a small green cart moving on a track. The horizontal scale is 8.00 seconds per square and the vertical scale is 10.00 centimeters/second per square. Horizontal Velocity (m/s) 0 A Time (s) The displacement of the cart over the span of the last three horizontal squares of Segment A, in cm and to one decimal place, isThe following graph shows the horizontal velocity as a function of time for a small green cart moving on a track. The horizontal scale is 8.00 seconds per square and the vertical scale is 10.00 centimeters/second per square. Horizontal Velocity (m/s) 0 A Time (s) The displacement of the cart over the span of the last three horizontal squares of Segment B, in cm and to one decimal place, isFor the following velocity versus time graph, at time t = 7 s the acceleration can best be described as m [\\J Velocity (m/s) 0 H I H I N a positive constant. increasing. a negative constant. decreasing. unable to be determined by the information in the graph. None of these choices is correct. ZEI'O. X (no answer) For the following velocity versus time graph, the displacement of the object that occurs during Segment F can best be described as Velocity (m/s) zero. None of these choices is correct. unable to be determined by the information in the graph. positive. negative
Step by Step Solution
There are 3 Steps involved in it

Get step-by-step solutions from verified subject matter experts