

Question: The following is a control chart for the average number of minor errors in 22 service reports. a. Determine the observed number of runs (median,
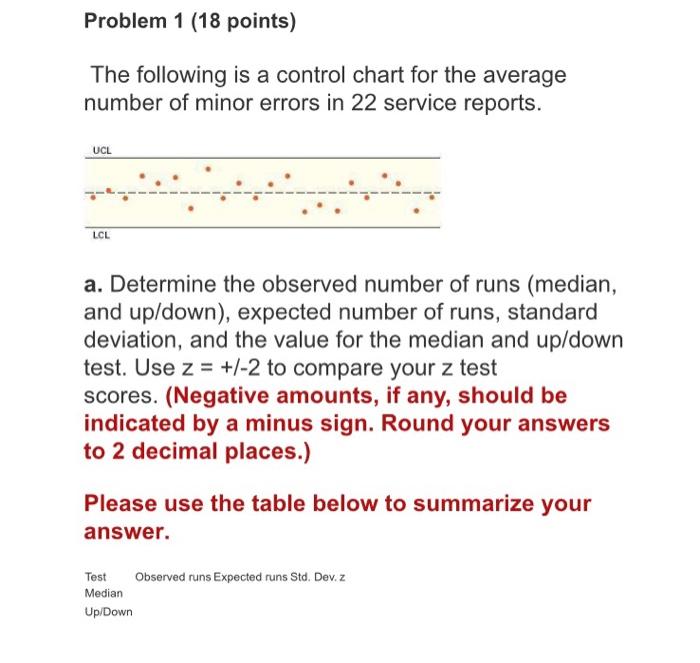
The following is a control chart for the average number of minor errors in 22 service reports. a. Determine the observed number of runs (median, and up/down), expected number of runs, standard deviation, and the value for the median and up/down test. Use z=+/2 to compare your z test scores. (Negative amounts, if any, should be indicated by a minus sign. Round your answers to 2 decimal places.) Please use the table below to summarize your answer. b. Based on your calculations, conclude whether the test is random or non-random. Test Conclusion (Random or Nonrandom) Median Up/Down c. Should the process be investigated due to nonrandom variation? (Yes or No)
Step by Step Solution
There are 3 Steps involved in it

Get step-by-step solutions from verified subject matter experts