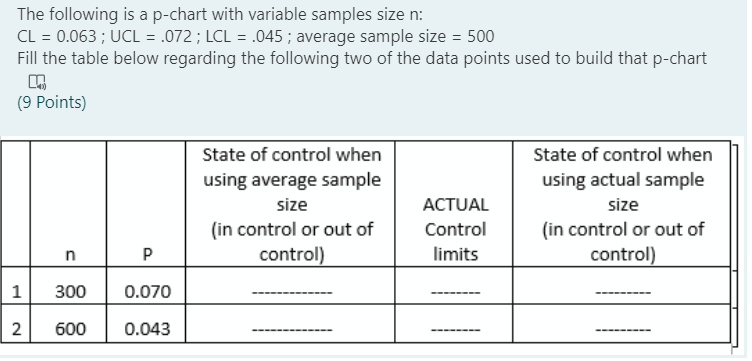
Question: The following is a p-chart with variable samples size n: CL = 0.063; UCL = .072; LCL = .045; average sample size = 500 Fill

The following is a p-chart with variable samples

The following is a p-chart with variable samples size n: CL = 0.063; UCL = .072; LCL = .045; average sample size = 500 Fill the table below regarding the following two of the data points used to build that p-chart (9 Points) State of control when ACTUAL using average sample size (in control or out of control) State of control when using actual sample size (in control or out of control) Control n P limits 1 300 0.070 2 600 0.043

Step by Step Solution

There are 3 Steps involved in it

1 Expert Approved Answer
Step: 1 Unlock blur-text-image
Question Has Been Solved by an Expert!

Get step-by-step solutions from verified subject matter experts

Step: 2 Unlock
Step: 3 Unlock

Students Have Also Explored These Related General Management Questions!