

The following is table shows the grouped data, in classes, for the height of 50 people. (
Fantastic news! We've Found the answer you've been seeking!
Question:
The following is table shows the grouped data, in classes, for the height of 50 people. ( ∑ f = n )
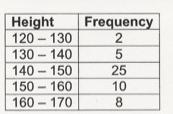
a) Calculate the mean of the height of 50 people.
b) Calculate the standard deviation of the height of 50 people.
height (in cm) - classes frequency (f) Mid Point (M) M x f
120 - 130 2
130 - 140 5
140 - 150 25
150 - 160 10
160 - 170 8
∑ f = ∑ M. f =
Mean of Height ( large overrightarrow{x} ) = frac{sumleft(M.fight)}{sum f} = ( up to 1 decimal place )
Blank 1:
Blank 2:
Blank 3:
Blank 4:
Blank 5:
Blank 6:
Blank 7:
Blank 8:
Blank 9:
Blank 10:
Blank 11:
Blank 12:
Blank 13:
Expert Answer:

Related Book For 

Posted Date:
