

Question: The following joint frequency distribution table shows responses from a sample of 187 unionized employees on how their union president handled a recent labour action.
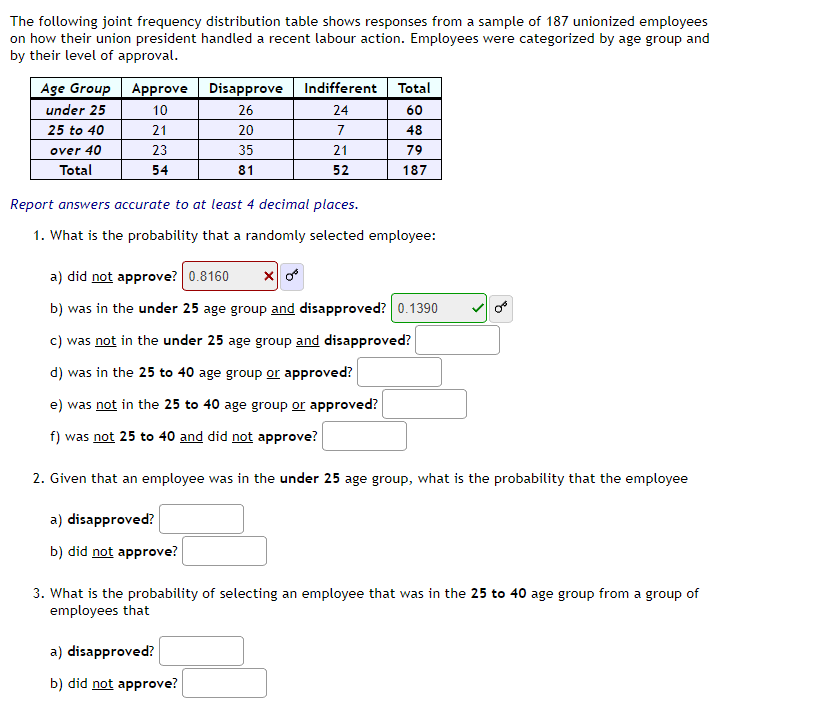
The following joint frequency distribution table shows responses from a sample of 187 unionized employees on how their union president handled a recent labour action. Employees were categorized by age group and by their level of approval. Age Group Approve Disapprove | Indifferent Total under 25 10 26 24 60 25 to 40 21 20 7 48 over 40 23 35 21 79 Total 54 81 52 187 Report answers accurate to at least 4 decimal places. 1. What is the probability that a randomly selected employee: a) did not approve? | 0.8160 X b) was in the under 25 age group and disapproved? | 0.1390 c) was not in the under 25 age group and disapproved? d) was in the 25 to 40 age group or approved? e) was not in the 25 to 40 age group or approved? f) was not 25 to 40 and did not approve? 2. Given that an employee was in the under 25 age group, what is the probability that the employee a) disapproved? b) did not approve? 3. What is the probability of selecting an employee that was in the 25 to 40 age group from a group of employees that a) disapproved? b) did not approve
Step by Step Solution
There are 3 Steps involved in it

Get step-by-step solutions from verified subject matter experts