

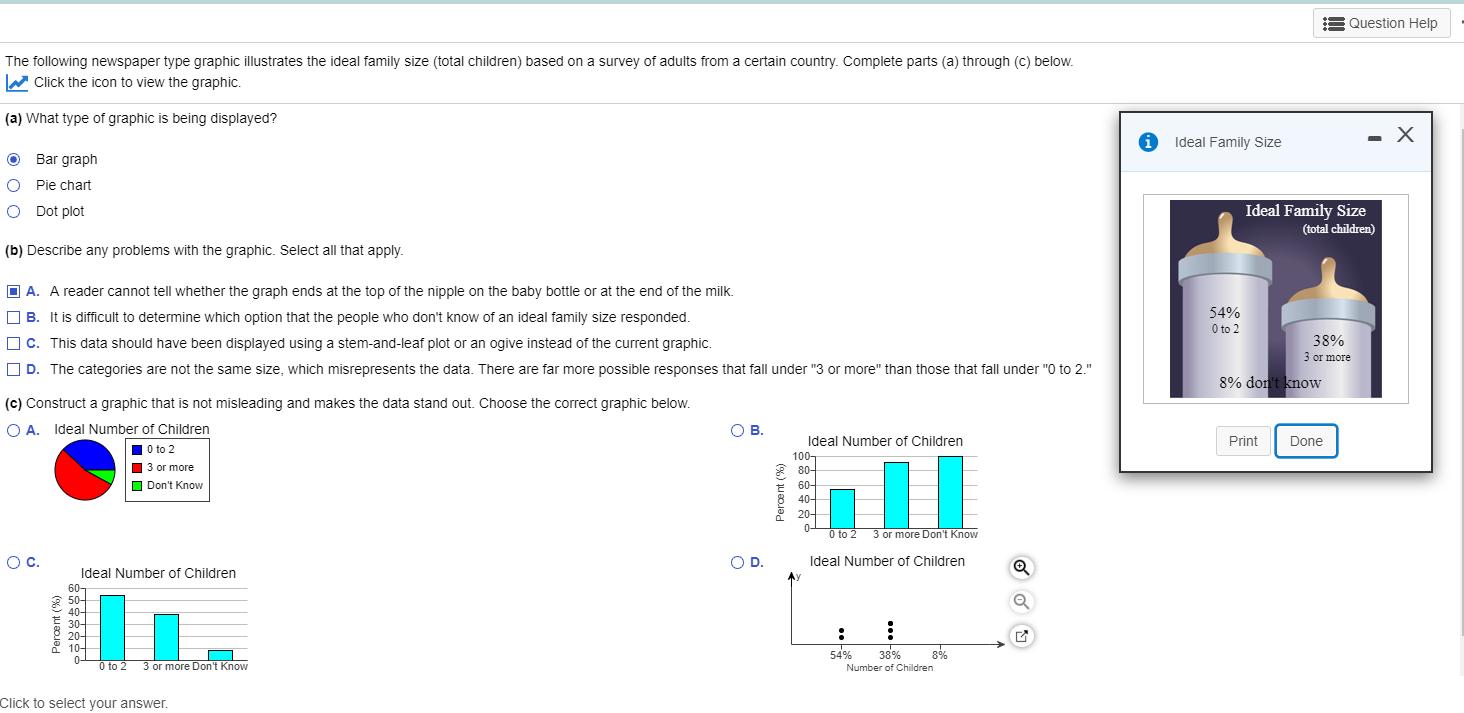
The following newspaper type graphic illustrates the ideal family size (total children) based on a survey...
Fantastic news! We've Found the answer you've been seeking!
Question:
Transcribed Image Text:
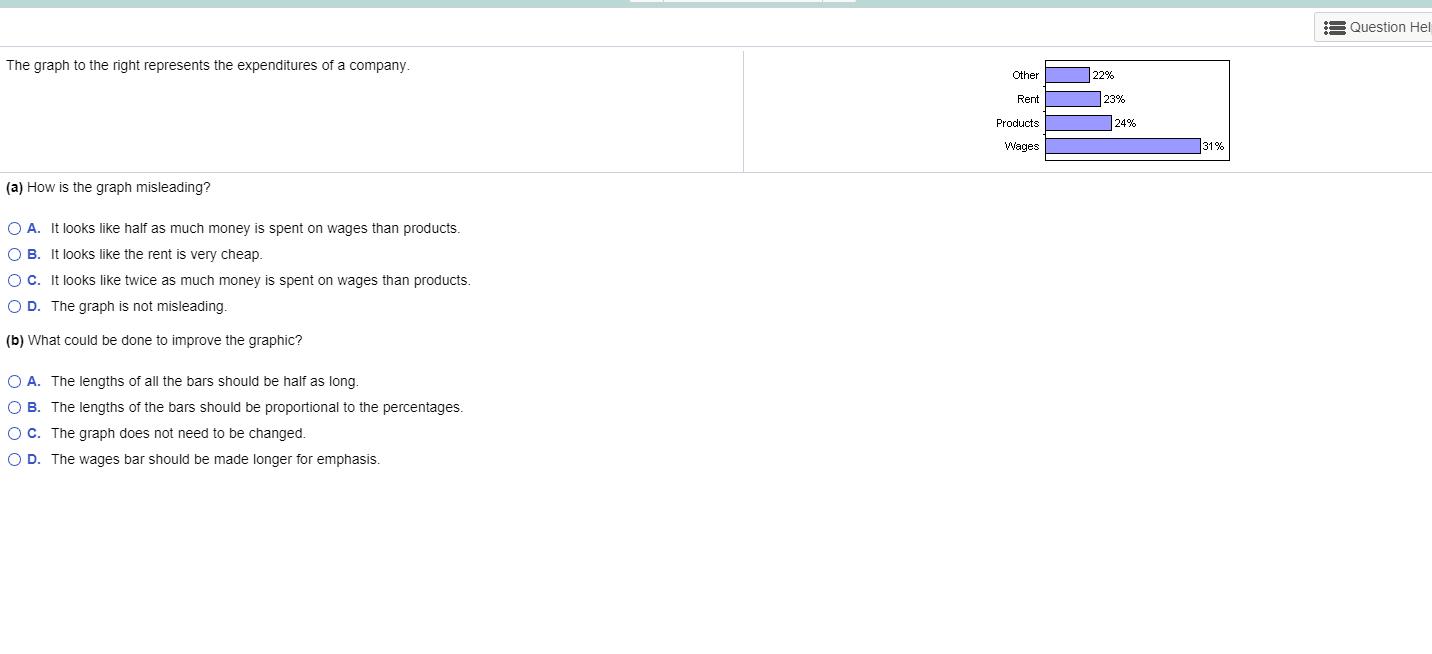
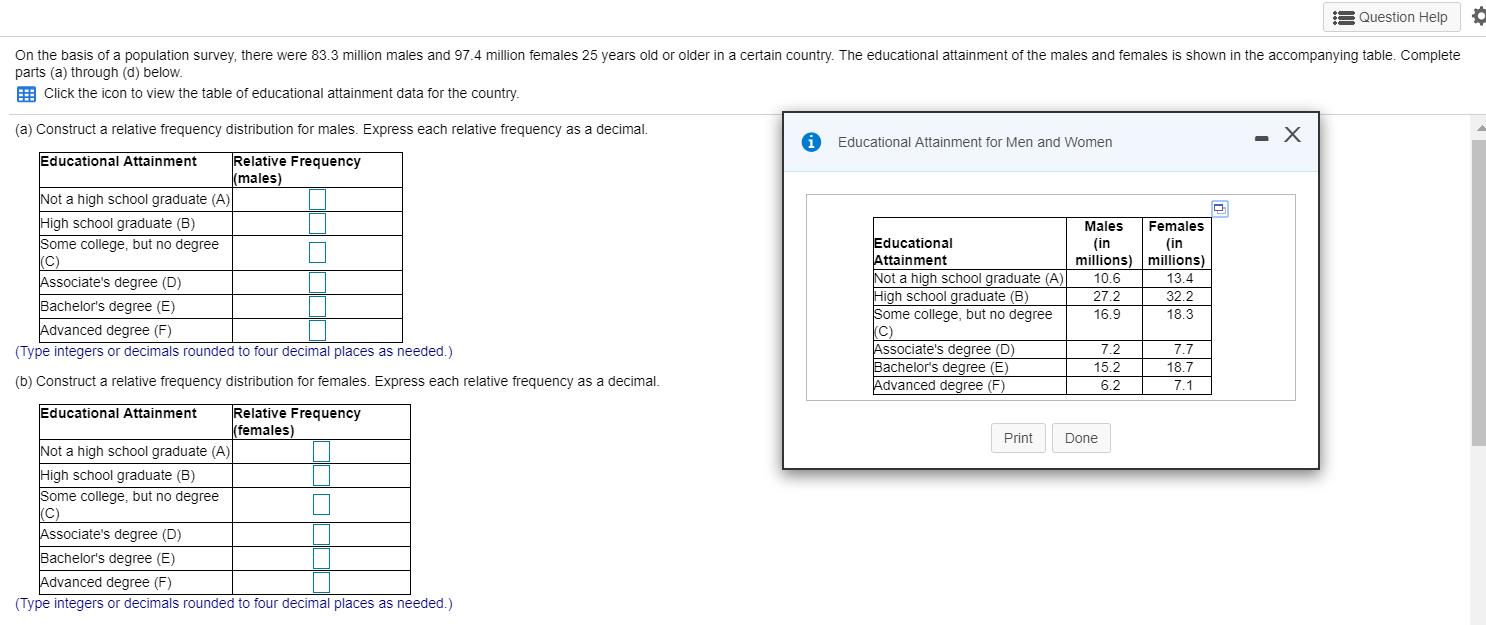
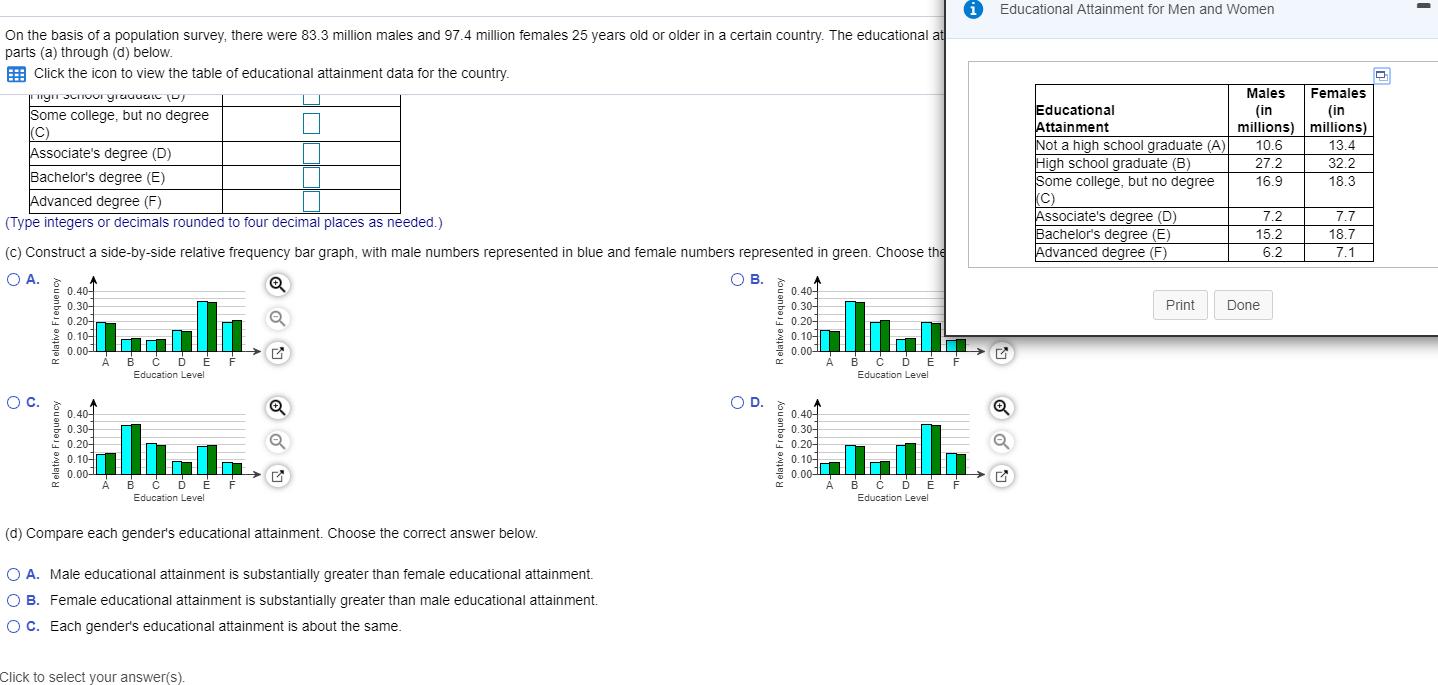
The following newspaper type graphic illustrates the ideal family size (total children) based on a survey of adults from a certain country. Complete parts (a) through (c) below. Click the icon to view the graphic. (a) What type of graphic is being displayed? O Bar graph O Pie chart O Dot plot (b) Describe any problems with the graphic. Select all that apply. A. A reader cannot tell whether the graph ends at the top of the nipple on the baby bottle or at the end of the milk. B. It is difficult to determine which option that the people who don't know of an ideal family size responded. C. This data should have been displayed using a stem-and-leaf plot or an ogive instead of the current graphic. D. The categories are not the same size, which misrepresents the data. There are far more possible responses that fall under "3 or more" than those that fall under "O to 2." (c) Construct a graphic that is not misleading and makes the data stand out. Choose the correct graphic below. O A. Ideal Number of Children 0 to 2 3 or more Don't Know O C. Ideal Number of Children 60- 50- 40- 30- 20- 10- 0- 0 to 2 3 or more Don't Know Click to select your answer. O B. O D. Ideal Number of Children 100 80- 60- 40- 20- Ay 0 to 2 3 or more Don't Know Ideal Number of Children : 38% Number of Children : 54% 8% Q a G i Ideal Family Size 54% 0 to 2 Ideal Family Size (total children) 8% don't know Print Question Help 38% 3 or more Done X The graph to the right represents the expenditures of a company. (a) How is the graph misleading? O A. It looks like half as much money is spent on wages than products. OB. It looks like the rent is very cheap. O C. It looks like twice as much money is spent on wages than products. OD. The graph is not misleading. (b) What could be done to improve the graphic? O A. The lengths of all the bars should be half as long. O B. The lengths of the bars should be proportional to the percentages. OC. The graph does not need to be changed. O D. The wages bar should be made longer for emphasis. Other Rent Products Wages 22% 23% 24% 31% Question Hel On the basis of a population survey, there were 83.3 million males and 97.4 million females 25 years old or older in a certain country. The educational attainment of the males and females is shown in the accompanying table. Complete parts (a) through (d) below. EEE Click the icon to view the table of educational attainment data for the country. (a) Construct a relative frequency distribution for males. Express each relative frequency as a decimal. Educational Attainment Relative Frequency (males) Not a high school graduate (A) High school graduate (B) Some college, but no degree (C) Associate's degree (D) Bachelor's degree (E) Advanced degree (F) (Type integers or decimals rounded to four decimal places as needed.) (b) Construct a relative frequency distribution for females. Express each relative frequency as a decimal. Educational Attainment Relative Frequency (females) Not a high school graduate (A) High school graduate (B) Some college, but no degree (C) Associate's degree (D) Bachelor's degree (E) Advanced degree (F) (Type integers or decimals rounded to four decimal places as needed.) i Educational Attainment for Men and Women Educational Attainment Not a high school graduate (A) High school graduate (B) Some college, but no degree (C) Associate's degree (D) Bachelor's degree (E) Advanced degree (F) Print Males (in millions) 10.6 27.2 16.9 7.2 15.2 6.2 Done Females (in millions) 13.4 32.2 18.3 7.7 18.7 7.1 0 - Question Help X On the basis of a population survey, there were 83.3 million males and 97.4 million females 25 years old or older in a certain country. The educational at parts (a) through (d) below. Click the icon to view the table of educational attainment data for the country. righ schoor graduale (0) Some college, but no degree (C) Associate's degree (D) Bachelor's degree (E) Advanced degree (F) (Type integers or decimals rounded to four decimal places as needed.) (c) Construct a side-by-side relative frequency bar graph, with male numbers represented in blue and female numbers represented in green. Choose the O A. O B. Q O C. R 0.40- 0.30- 0.20- 0.10- 0.00 0.40 0.30- 0.20- 0.10- 0.00- А BCDEF Education Level A B C D E F Education Level G Q Q Click to select your answer(s). G (d) Compare each gender's educational attainment. Choose the correct answer below. O A. Male educational attainment is substantially greater than female educational attainment. O B. Female educational attainment is substantially greater than male educational attainment. O C. Each gender's educational attainment is about the same. O D. R 0.40 0.30- 0.20- 0.10- 0.00- 0.40 0.30- 0.20- 0.10- 0.001 B Ć DÉF Education Level A B C D E F Education Level i Educational Attainment for Men and Women 5 Q Educational Attainment Not a high school graduate (A) High school graduate (B) Some college, but no degree (C) Associate's degree (D) Bachelor's degree (E) Advanced degree (F) Print Males Females (in (in millions) millions) 10.6 13.4 27.2 32.2 16.9 18.3 7.2 15.2 6.2 Done 7.7 18.7 7.1 I The following newspaper type graphic illustrates the ideal family size (total children) based on a survey of adults from a certain country. Complete parts (a) through (c) below. Click the icon to view the graphic. (a) What type of graphic is being displayed? O Bar graph O Pie chart O Dot plot (b) Describe any problems with the graphic. Select all that apply. A. A reader cannot tell whether the graph ends at the top of the nipple on the baby bottle or at the end of the milk. B. It is difficult to determine which option that the people who don't know of an ideal family size responded. C. This data should have been displayed using a stem-and-leaf plot or an ogive instead of the current graphic. D. The categories are not the same size, which misrepresents the data. There are far more possible responses that fall under "3 or more" than those that fall under "O to 2." (c) Construct a graphic that is not misleading and makes the data stand out. Choose the correct graphic below. O A. Ideal Number of Children 0 to 2 3 or more Don't Know O C. Ideal Number of Children 60- 50- 40- 30- 20- 10- 0- 0 to 2 3 or more Don't Know Click to select your answer. O B. O D. Ideal Number of Children 100 80- 60- 40- 20- Ay 0 to 2 3 or more Don't Know Ideal Number of Children : 38% Number of Children : 54% 8% Q a G i Ideal Family Size 54% 0 to 2 Ideal Family Size (total children) 8% don't know Print Question Help 38% 3 or more Done X The graph to the right represents the expenditures of a company. (a) How is the graph misleading? O A. It looks like half as much money is spent on wages than products. OB. It looks like the rent is very cheap. O C. It looks like twice as much money is spent on wages than products. OD. The graph is not misleading. (b) What could be done to improve the graphic? O A. The lengths of all the bars should be half as long. O B. The lengths of the bars should be proportional to the percentages. OC. The graph does not need to be changed. O D. The wages bar should be made longer for emphasis. Other Rent Products Wages 22% 23% 24% 31% Question Hel On the basis of a population survey, there were 83.3 million males and 97.4 million females 25 years old or older in a certain country. The educational attainment of the males and females is shown in the accompanying table. Complete parts (a) through (d) below. EEE Click the icon to view the table of educational attainment data for the country. (a) Construct a relative frequency distribution for males. Express each relative frequency as a decimal. Educational Attainment Relative Frequency (males) Not a high school graduate (A) High school graduate (B) Some college, but no degree (C) Associate's degree (D) Bachelor's degree (E) Advanced degree (F) (Type integers or decimals rounded to four decimal places as needed.) (b) Construct a relative frequency distribution for females. Express each relative frequency as a decimal. Educational Attainment Relative Frequency (females) Not a high school graduate (A) High school graduate (B) Some college, but no degree (C) Associate's degree (D) Bachelor's degree (E) Advanced degree (F) (Type integers or decimals rounded to four decimal places as needed.) i Educational Attainment for Men and Women Educational Attainment Not a high school graduate (A) High school graduate (B) Some college, but no degree (C) Associate's degree (D) Bachelor's degree (E) Advanced degree (F) Print Males (in millions) 10.6 27.2 16.9 7.2 15.2 6.2 Done Females (in millions) 13.4 32.2 18.3 7.7 18.7 7.1 0 - Question Help X On the basis of a population survey, there were 83.3 million males and 97.4 million females 25 years old or older in a certain country. The educational at parts (a) through (d) below. Click the icon to view the table of educational attainment data for the country. righ schoor graduale (0) Some college, but no degree (C) Associate's degree (D) Bachelor's degree (E) Advanced degree (F) (Type integers or decimals rounded to four decimal places as needed.) (c) Construct a side-by-side relative frequency bar graph, with male numbers represented in blue and female numbers represented in green. Choose the O A. O B. Q O C. R 0.40- 0.30- 0.20- 0.10- 0.00 0.40 0.30- 0.20- 0.10- 0.00- А BCDEF Education Level A B C D E F Education Level G Q Q Click to select your answer(s). G (d) Compare each gender's educational attainment. Choose the correct answer below. O A. Male educational attainment is substantially greater than female educational attainment. O B. Female educational attainment is substantially greater than male educational attainment. O C. Each gender's educational attainment is about the same. O D. R 0.40 0.30- 0.20- 0.10- 0.00- 0.40 0.30- 0.20- 0.10- 0.001 B Ć DÉF Education Level A B C D E F Education Level i Educational Attainment for Men and Women 5 Q Educational Attainment Not a high school graduate (A) High school graduate (B) Some college, but no degree (C) Associate's degree (D) Bachelor's degree (E) Advanced degree (F) Print Males Females (in (in millions) millions) 10.6 13.4 27.2 32.2 16.9 18.3 7.2 15.2 6.2 Done 7.7 18.7 7.1 I
Expert Answer:
Answer rating: 100% (QA)
Question a The correct option is A Bar Chart b The correct option is A A reader cannot tell whether ... View the full answer

Related Book For 

Posted Date:
Students also viewed these mathematics questions
-
Planning is one of the most important management functions in any business. A front office managers first step in planning should involve determine the departments goals. Planning also includes...
-
Managing Scope Changes Case Study Scope changes on a project can occur regardless of how well the project is planned or executed. Scope changes can be the result of something that was omitted during...
-
Let Find x , y , xy , and yx , and state the domain for each partial derivative. f(x, y) = [y, y = 0 1-y, y < 0.
-
You are the in charge auditor examining the financial statements of the Gutzler Company for the year ended December 31. During late October, with the help of Gutzlers controller, you completed an...
-
Kwam Solutions must raise 120 million. Kwam has two primary sources of liquidity: 60 million of marketable securities (which can be sold with minimal liquidation/ brokerage costs) and 30 million of...
-
What is the velocity ratio of the first system of pulleys ?
-
A reverse-osmosis plant is used to treat 30,000,000 gal/day of seawater at 20C containing 3.5 wt% dissolved solids to produce 10,000,000 gal/day of potable water with 500 ppm of dissolved solids, and...
-
Cost overruns and extraordinary spending by healthcare organizations harms the sustainability of the healthcare organization. Through activity-based costing (ABC), the healthcare industry is working...
-
Provide an example, with rationale, of an area in your personal life where you would like to apply time value of money concepts. What can you do to create a more financially sound future for yourself?
-
In Yeelen (1987), how did director Souleymane Cisse' use his modern filmmaker view, to communicate the people, mythologies and world of ancient Mali? What did you see that you did not understand?...
-
What does the tax law include in amount realized?
-
Doagile methods hinder object-oriented programming? Why?
-
Job security, health security, and so on come under: Security needs Social needs Esteem needs Self-actualization
-
Why must a preliminary conceptual model be made during the Inception phase?
-
Explain in detail how a delegate message that appears in a sequence diagram must be implemented.
-
One of the barriers to listening identified is "information overload." How could this be a product of modern, mediated communication and specifically of technological channels like social media?...
-
A researcher reports a significant two-way between-subjects ANOVA, F(3, 40) = 2.96. State the decision to retain or reject the null hypothesis for this test.
-
In a poll conducted July 2729, 2010, a random sample of 2163 adults (aged 18 and over) was asked, Given a choice of the following, which one would you most want to be? The results of the survey are...
-
A simple random sample of size n = 210 is drawn from a population. The sample mean is found to be x = 20.1, and the sample standard deviation is found to be s = 3.2. Construct a 90% condence interval...
-
n = 300, p = 0.7 Describe the sampling distribution of . Assume that the size of the population is 25,000 for each problem.
-
The hospital where you are completing your internship is located in an inner city neighborhood with a multi-lingual, diverse population. Recently, the local newspaper has been running a series about...
-
Over the past month, every member of the Intravenous (IV) Therapy Team has complained to you about the IV Team supervisor. Her direct reports, all RNs, agree that she is technically superb. However,...
-
What are the benefits of implementing programs to address cultural competence within a health care organization? What are the costs of not implementing such programs?

Study smarter with the SolutionInn App