

Question: The following observations are for two quantitative variables, and Y. Observation x Y Observation I 1 15 69 2 19 80 12 11 29
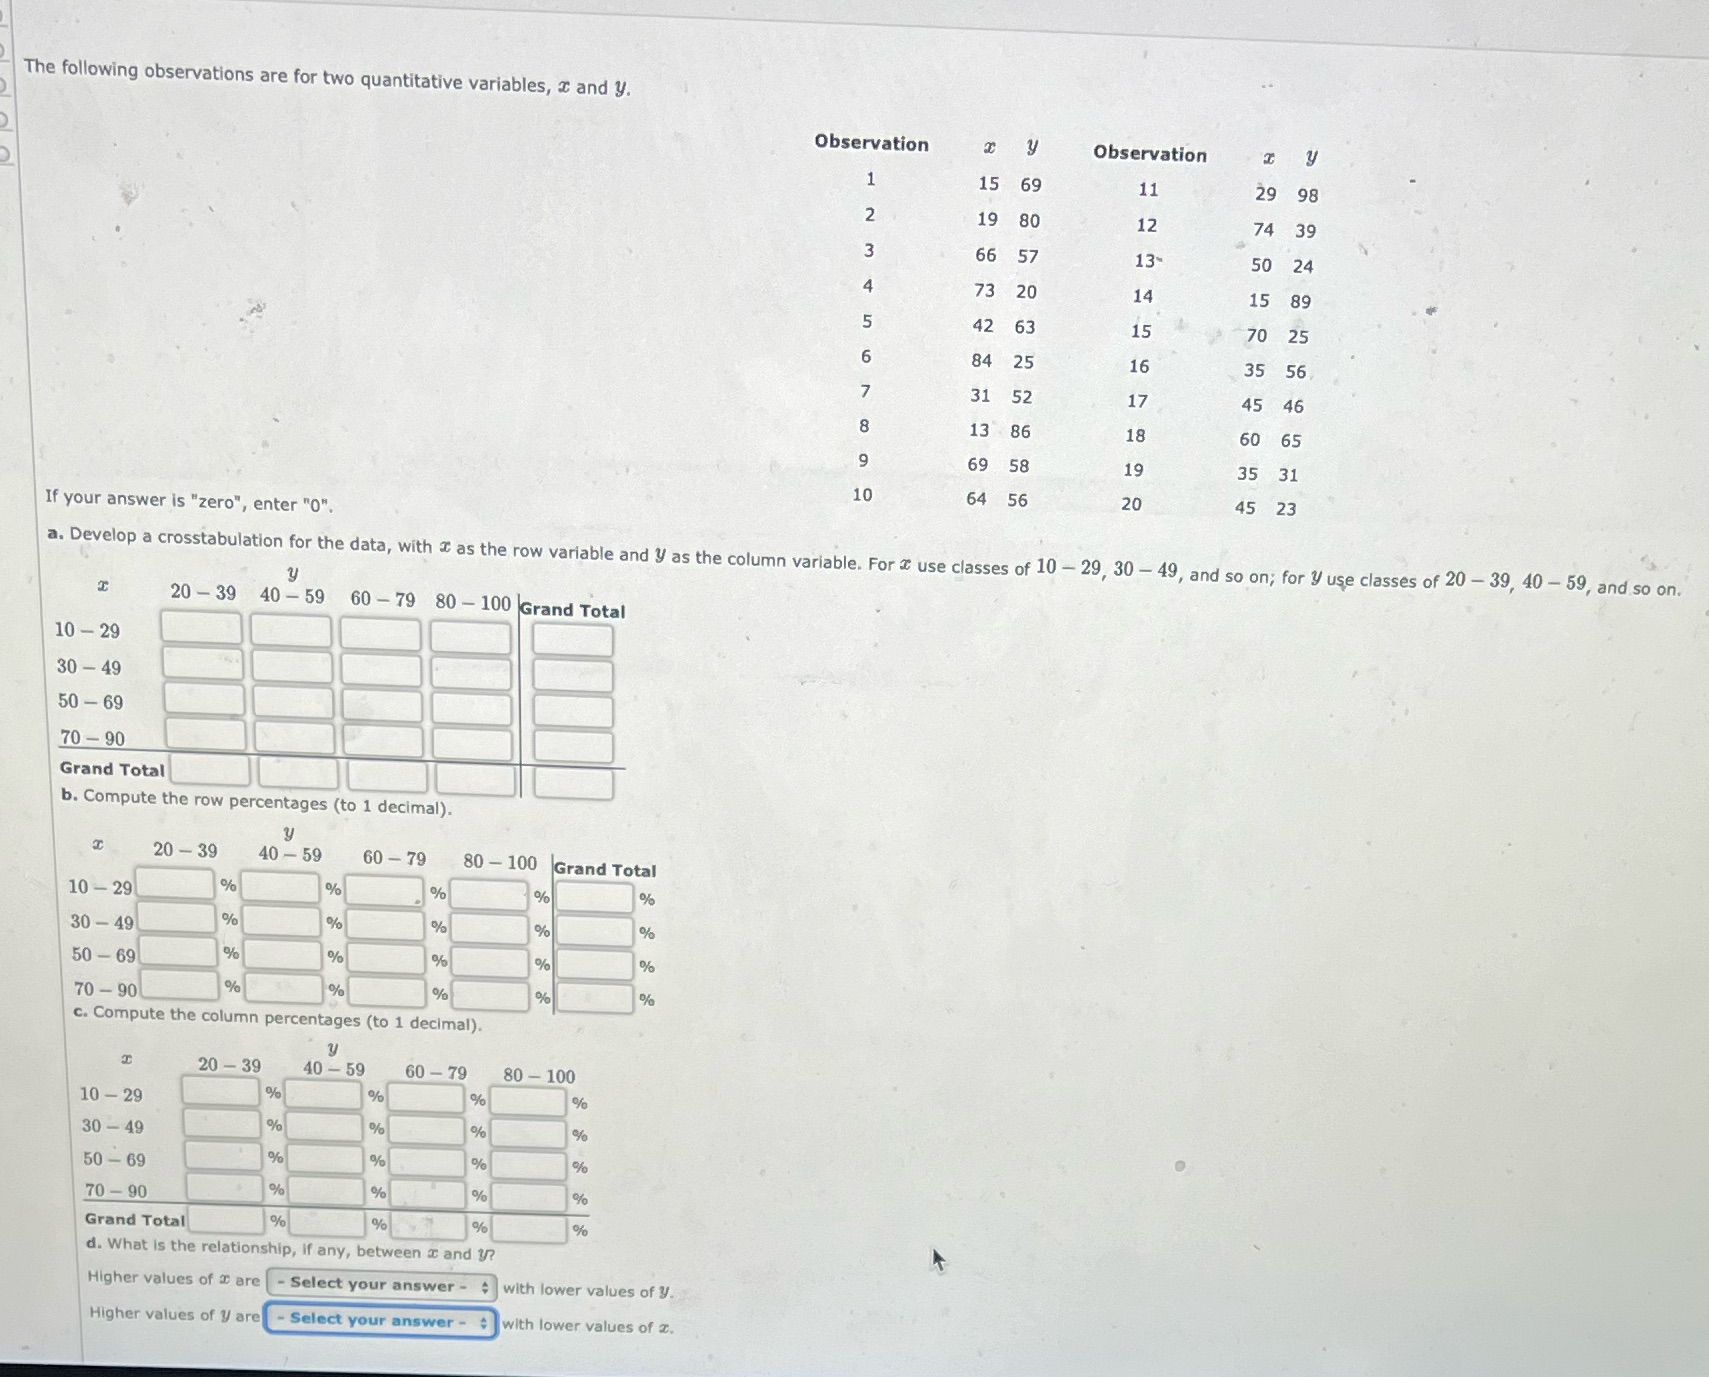
The following observations are for two quantitative variables, and Y. Observation x Y Observation I 1 15 69 2 19 80 12 11 29 98 12 74 39 3 66 57 13- 50 24 4 73 20 14 15 89 5 42 63 15 6 84 25 16 7 31 52 17 567 70 25 35 56 45 46 8 13 86 18 60 65 9 69 58 19 35 31 10 64 56 20 20 45 23 If your answer is "zero", enter "0". a. Develop a crosstabulation for the data, with as the row variable and y as the column variable. For use classes of 10-29, 30-49, and so on; for y use classes of 20-39, 40-59, and so on. y I 20-39 40-59 60-79 80-100 Grand Total 10-29 30-49 50-69 70-90 Grand Total b. Compute the row percentages (to 1 decimal). y 8 20-39 40-59 60-79 80-100 Grand Total 10-29 % % % % % % % % % % 30-49 50-69 % % % % % % % % % % 70-90 c. Compute the column percentages (to 1 decimal). H 20-39 40-59 60-79 80-100 10-29 % % % % 30-49 % % % % 50-69 % % % % 70-90 % % % % Grand Total % % % % d. What is the relationship, if any, between and Y? Higher values of are - Select your answer with lower values of Y. Higher values of y are Select your answer with lower values of z.
Step by Step Solution
There are 3 Steps involved in it

Get step-by-step solutions from verified subject matter experts