

Question: The following scatterplot shows the mean annual carbon dioxide?(CO2) in parts per million? (ppm) measured at the top of a mountain and the mean annual
The following scatterplot shows the mean annual carbon dioxide?(CO2) in parts per million? (ppm) measured at the top of a mountain and the mean annual air temperature over both land and sea across the? globe, in degrees Celsius? (C).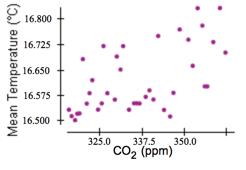
a) What is the correlation between CO2 and? Temperature?
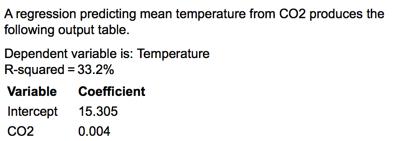
b) Explain the meaning of? R-squared in this context
Dependent variable? is: Temperature
?R-squaredequals= 33.2 %
Variable | Coefficient |
Intercept | 15.305 |
CO2 | 0.004 |
c) Give the regression equation
d) What is the meaning of the slope of this? equation?
?e) What is the meaning of the? y-intercept of this? equation?
g) Suppose CO2 levels reach 363 ppm this year. What mean temperature does the regression predict from this? information?
16.00 16.800 16.725 16.650 16.575 16.500 325.0 337.5 350.0 CO2 (ppm) Mean Temperature (C)
Step by Step Solution
3.41 Rating (151 Votes )
There are 3 Steps involved in it
Solution Given R 2 332 a The correlation between CO2 and temper... View full answer

Get step-by-step solutions from verified subject matter experts