

The following table gives data on gross domestic product (GDP) for the United States for the...
Fantastic news! We've Found the answer you've been seeking!
Question:
Transcribed Image Text:
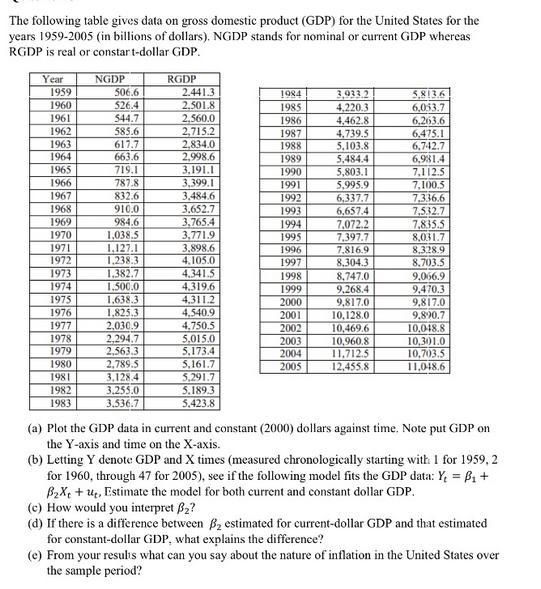
The following table gives data on gross domestic product (GDP) for the United States for the years 1959-2005 (in billions of dollars). NGDP stands for nominal or current GDP whereas RGDP is real or constart-dollar GDP. Year 1959 1960 1961 1962 1963 1964 1965 1966 1967 1968 1969 1970 1971 1972 1973 1974 1975 1976 1977 1978 1979 1980 1981 1982 1983 NGDP 506.6 526.4 544.7 585.6 617.7 663.6 719.1 787.8 832.6 910.0 984.6 1.038.5 1.127.1 1,238.3 1,382.7 1,500.0 1,638.3 1,825.3 2,030.9 2,294.7 2,563.3 2,789.5 3,128.4 3.255.0 3.536.7 RGDP 2.441.3 2.501.8 2,560.0 2,715.2 2,834.0 2.998.6 3,191.1 3,399.1 3,484.6 3.652.7 3,765.4 3,771.9 3,898.6 4,105.0 4,341.5 4,319.6 4,311.2 4,540.9 4,750.5 5,015.0 5,173.4 5,161.7 5,291.7 5.189.3 5.423.8 1984 1985 1986 1987 1988 1989 1990 1991 1992 1993 1994 1995 1996 1997 1998 1999 2000 2001 2002 2003 2004 2005 3,933.2 4,220.3 4,462.8 4,739.5 5,103.8 5,484.4 5,803.1 5,995.9 6,337,7 6,657.4 7,072.2 7,397.7 7,816.9 8.304.3 8,747.0 9,268.4 9,817.0 10,128.0 10,469.6 10,960.8 11,712.5 12,455.8 5,813.6 6,053.7 6,263.6 6,475.1 6,742.7 6,9814 7,112.5 7,100.5 7.336.6 7,532.7 7.835.5 8,031.7 8,328.9 8.703.5 9,066.9 9,470.3 9,817.0 9,890.7 10,048.8 10,301.0 10,703.5 11,048.6 (a) Plot the GDP data in current and constant (2000) dollars against time. Note put GDP on the Y-axis and time on the X-axis. (b) Letting Y denote GDP and X times (measured chronologically starting with I for 1959, 2 for 1960, through 47 for 2005), see if the following model fits the GDP data: Y = B + BX +u, Estimate the model for both current and constant dollar GDP. (c) How would you interpret 3? (d) If there is a difference between B estimated for current-dollar GDP and that estimated for constant-dollar GDP, what explains the difference? (e) From your results what can you say about the nature of inflation in the United States over the sample period? The following table gives data on gross domestic product (GDP) for the United States for the years 1959-2005 (in billions of dollars). NGDP stands for nominal or current GDP whereas RGDP is real or constart-dollar GDP. Year 1959 1960 1961 1962 1963 1964 1965 1966 1967 1968 1969 1970 1971 1972 1973 1974 1975 1976 1977 1978 1979 1980 1981 1982 1983 NGDP 506.6 526.4 544.7 585.6 617.7 663.6 719.1 787.8 832.6 910.0 984.6 1.038.5 1.127.1 1,238.3 1,382.7 1,500.0 1,638.3 1,825.3 2,030.9 2,294.7 2,563.3 2,789.5 3,128.4 3.255.0 3.536.7 RGDP 2.441.3 2.501.8 2,560.0 2,715.2 2,834.0 2.998.6 3,191.1 3,399.1 3,484.6 3.652.7 3,765.4 3,771.9 3,898.6 4,105.0 4,341.5 4,319.6 4,311.2 4,540.9 4,750.5 5,015.0 5,173.4 5,161.7 5,291.7 5.189.3 5.423.8 1984 1985 1986 1987 1988 1989 1990 1991 1992 1993 1994 1995 1996 1997 1998 1999 2000 2001 2002 2003 2004 2005 3,933.2 4,220.3 4,462.8 4,739.5 5,103.8 5,484.4 5,803.1 5,995.9 6,337,7 6,657.4 7,072.2 7,397.7 7,816.9 8.304.3 8,747.0 9,268.4 9,817.0 10,128.0 10,469.6 10,960.8 11,712.5 12,455.8 5,813.6 6,053.7 6,263.6 6,475.1 6,742.7 6,9814 7,112.5 7,100.5 7.336.6 7,532.7 7.835.5 8,031.7 8,328.9 8.703.5 9,066.9 9,470.3 9,817.0 9,890.7 10,048.8 10,301.0 10,703.5 11,048.6 (a) Plot the GDP data in current and constant (2000) dollars against time. Note put GDP on the Y-axis and time on the X-axis. (b) Letting Y denote GDP and X times (measured chronologically starting with I for 1959, 2 for 1960, through 47 for 2005), see if the following model fits the GDP data: Y = B + BX +u, Estimate the model for both current and constant dollar GDP. (c) How would you interpret 3? (d) If there is a difference between B estimated for current-dollar GDP and that estimated for constant-dollar GDP, what explains the difference? (e) From your results what can you say about the nature of inflation in the United States over the sample period?
Expert Answer:

Related Book For 

Posted Date:
Students also viewed these economics questions
-
Discuss an opinion piece supporting that electric cars are not the future. The opinion piece should be presented in the form of a one-sided argument. This piece should be very well written-free of...
-
During your work placement, identify a work practice and related policy or procedure that you think could be improved to better meet legal requirements or responsibilities.
-
Associated Media Graphics (AMG) is a rapidly expanding company involved in the mass reproduction of instructional materials. Ralph Boston, owner and manager of AMG, has made a concentrated effort...
-
In a daring rescue by helicopter, two men with a combined mass of 172 kg are lifted to safety. (a) If the helicopter lifts the men straight up with constant acceleration, is the tension in the rescue...
-
One of the constituents of turpentine is α -pinene, formula C10H16 The following scheme (called a "road map") gives some reactions of a-pinene. Determine the structure of a-pinene and...
-
An instructor administers a 27 -item quiz to her class of 25 students. Each student's score on the quiz is the number of items answered correctly. These scores are listed below: a. Construct a...
-
a. = 3 customers/hour = 5 customers/hour M = 1 1) What is the system utilization? 2) What is the average number of customers waiting for service? 3) What is the average time customers wait in line...
-
(13%) Problem 4: A student standing on a cliff throws a stone from a vertical height of d = 8.0 m above the level ground with velocity vo = 18 m/s at an angle 0 = 32 below the horizontal, as shown....
-
Bradburn plc was formed 5 years ago through a public subscription of ordinary shares. Daniel Brown, who owns 15% of the ordinary shares, was one of the organizers of Bradburn and is its current...
-
For those clients concerned about providing for a surviving spouse or common-law partner, what can a financial planner do?
-
Calculate the pretax yield(yp), after tax yield implied by the potentially-flawed formula(ya), after-tax yield assuming capital gains are only taxed at maturity and coupon payments are taxed...
-
2. Imagine that you would like to know your friend's outcome-based social preferences. You ask her to make choices between divisions of money. Here is what she chooses: (i) She chooses $4 for herself...
-
The marginal cost of producing Hwatoo (or Hanafuda) sets is constant at # 1,000 per a set in the competitive market. Though the market demand is known to be perfectly inelastic, the compensated...
-
1. If the price of one Weight Watchers frozen dinner is $2 andthe price of one dozen jelly doughnuts is $1, which of thefollowing would Kent, a utility-maximizing consumer, buy with his$6? 2. If the...
-
What is the coupon rate of a 9-year,$1,000bond with coupons paid annually and a price of $900,if it has a yield to maturity of 5.00%? NOTE:Answer with two decimals after the dot.DO NOT USE the...
-
Assume the following data concerning a purchase of merchandise by Icon Co. on April 2: April 2. Purchased $4,000 of merchandise on account from Gamma Co., terms 2/10, n/30. 4. Returned $2,000 of the...
-
The following selected information was taken from Sun Valley Citys general fund statement of revenues, expenditures, and changes in fund balance for the year ended December 31, 2019: Revenues:...
-
Estimating the capital asset pricing model (CAPM). In Section 6.1 we considered briefly the well-known capital asset pricing model of modern portfolio theory. In empirical analysis, the CAPM is...
-
Suppose the true model is Y i = 1 + 2 X i + X 2i + 3 X 3i + u i But you estimate Y i = 1 + 2 X i + v i If you use observations of Y at X = 3, 2, 1, 0, 1, 2, 3, and estimate the incorrect model,...
-
From the scattergram given in Figure 2.9, what general conclusions do you draw? What is the economic theory that underlies this scattergram? 10 11 12 6. Scarce land; Abundant land; less skilled...
-
Match the terms in the first column with an appropriate definition from the second column. Terms (a) Breakeven analysis (b) Sensitivity analysis (c) Risk analysis Definitions (1) Determining how the...
-
Cecils Manufacturing is considering producing a new product. The sales price would be \($10.25\) per unit. The cost of the equipment is \($100,000.\) Operating and maintenance (O&M) costs are...
-
The Fence Company is setting up a new production line to create top rails. The relevant data for two alternatives are shown below. a. Based on MARR of 8 percent, determine the annual rate of...

Study smarter with the SolutionInn App