

Question: The following table presents the data for Cao Da Inc. as of December 31, 2018: Accounts payable Accounts receivable Cash and cash equivalents COGS Common
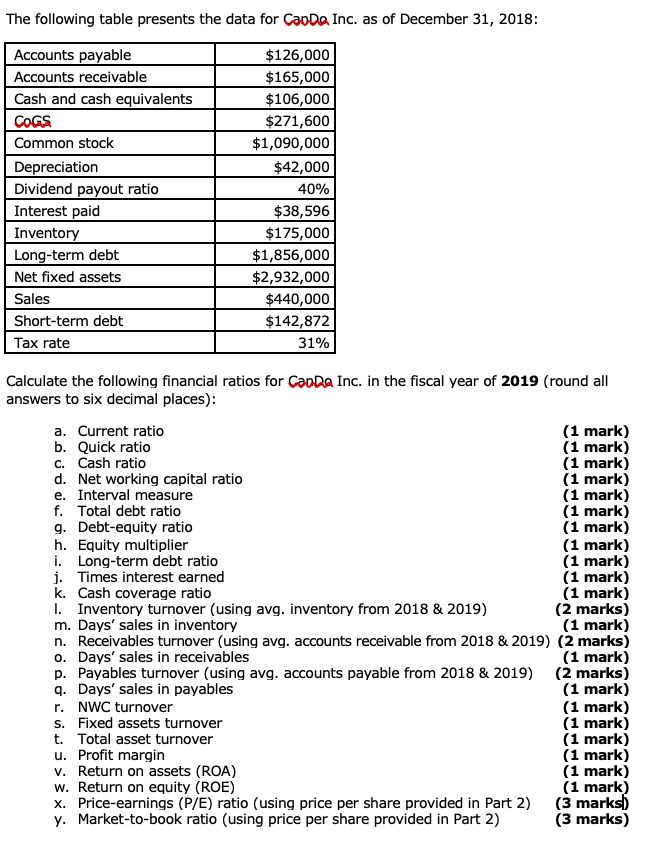
The following table presents the data for Cao Da Inc. as of December 31, 2018: Accounts payable Accounts receivable Cash and cash equivalents COGS Common stock Depreciation Dividend payout ratio Interest paid Inventory Long-term debt Net fixed assets Sales Short-term debt Tax rate $126,000 $165,000 $106,000 $271,600 $1,090,000 $42,000 40% $38,596 $175,000 $1,856,000 $2,932,000 $440,000 $142,872 31% Calculate the following financial ratios for CanDa Inc. in the fiscal year of 2019 (round all answers to six decimal places): a. Current ratio (1 mark) b. Quick ratio (1 mark) C. Cash ratio (1 mark) d. Net working capital ratio (1 mark) e. Interval measure (1 mark) f. Total debt ratio (1 mark) g. Debt-equity ratio (1 mark) h. Equity multiplier (1 mark) i. Long-term debt ratio (1 mark) j. Times interest earned (1 mark) k. Cash coverage ratio (1 mark) 1. Inventory turnover (using avg. inventory from 2018 & 2019) (2 marks) m. Days' sales in inventory (1 mark) n. Receivables turnover (using avg. accounts receivable from 2018 & 2019) (2 marks) o. Days' sales in receivables (1 mark) p. Payables turnover (using avg. accounts payable from 2018 & 2019) (2 marks) 9. Days' sales in payables (1 mark) r. NWC turnover (1 mark) s. Fixed assets turnover (1 mark) t. Total asset turnover (1 mark) u. Profit margin (1 mark) v. Return on assets (ROA) (1 mark) w. Return on equity (ROE) (1 mark) X. Price-earnings (P/E) ratio (using price per share provided in Part 2) (3 marks) y. Market-to-book ratio (using price per share provided in Part 2)
Step by Step Solution
There are 3 Steps involved in it

Get step-by-step solutions from verified subject matter experts