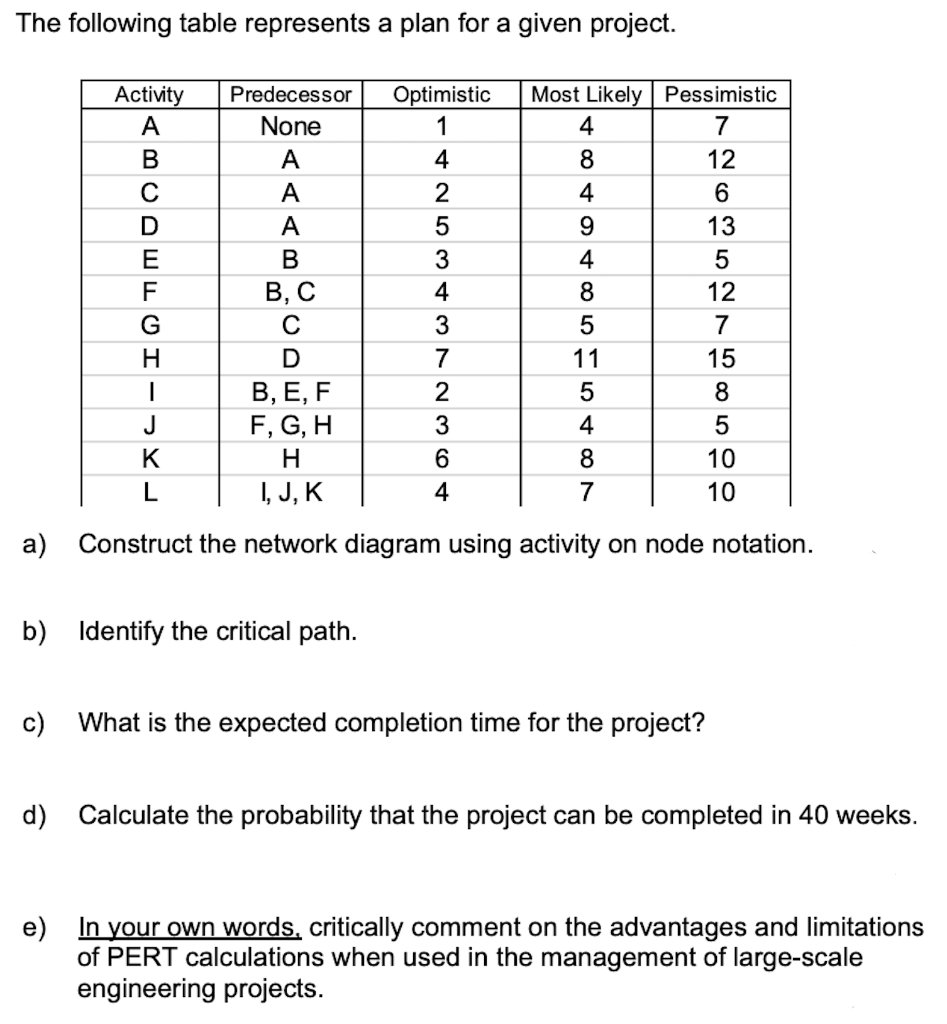
Question: The following table represents a plan for a given project. Optimistic 1 Activity A B C D E F G H Predecessor None A A

The following table represents a plan for a given

The following table represents a plan for a given project. Optimistic 1 Activity A B C D E F G H Predecessor None A A A B B, C C D B, E, F F,G,H H I, J, K 4 2 5 3 4 3 7 2 3 6 4 Most Likely | Pessimistic 4 7 8 12 4 6 9 13 4 5 8 12 5 7 11 15 5 8 4 5 8 10 7 10 a) Construct the network diagram using activity on node notation. b) Identify the critical path. c) What is the expected completion time for the project? d) Calculate the probability that the project can be completed in 40 weeks. e) In your own words, critically comment on the advantages and limitations of PERT calculations when used in the management of large-scale engineering projects

Step by Step Solution

There are 3 Steps involved in it

1 Expert Approved Answer
Step: 1 Unlock blur-text-image
Question Has Been Solved by an Expert!

Get step-by-step solutions from verified subject matter experts

Step: 2 Unlock
Step: 3 Unlock

Students Have Also Explored These Related General Management Questions!