

Question: The following table shows a hypothetical short-run production function, where L is the number of labor units, K is the amount of capital (fixed in
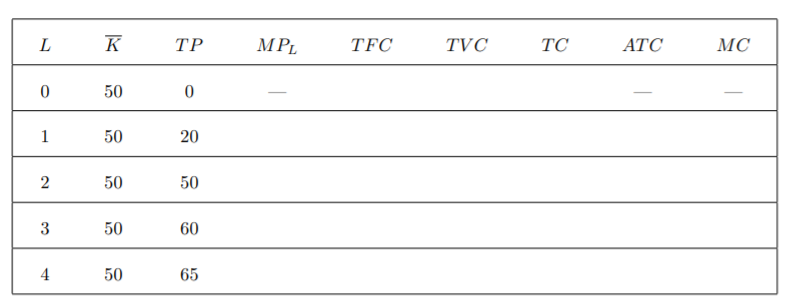
The following table shows a hypothetical short-run production function, where L is the number of labor units, K is the amount of capital (fixed in the short-run), and T P is the total product. The total product is measured in units produced per day. The price of labor is $50 per unit and day. The price of capital is $2 per unit and day.
(a) Fill in the table above. You don't need to fill in MPL, AT C, and MC in the first row (where L = 0). Note that MPL is the marginal product of labor, T F C is the total fixed costs, T V C is the total variable costs, T C is the total cost, AT C is the average total cost, and MC is the marginal cost. (b) Draw the total product curve (in a diagram with L on the x-axis and T P on the y-axis) and the marginal cost curve (in a diagram with quantity on the x-axis and $ on the y-axis). Explain the economic intuition for the shapes of the curves. (c) Suppose the price of the product the company sells is P = 5 per unit and the market is perfectly competitive. How many units of labor should the company employ to maximize profit? Explain the reasoning behind your answer.
\f
Step by Step Solution
There are 3 Steps involved in it

Get step-by-step solutions from verified subject matter experts