

Question: The following table shows the annual expected returns for two stocks. Probability of return Stock A Stock B 0.10 -10% 0.20 21 1 0.40
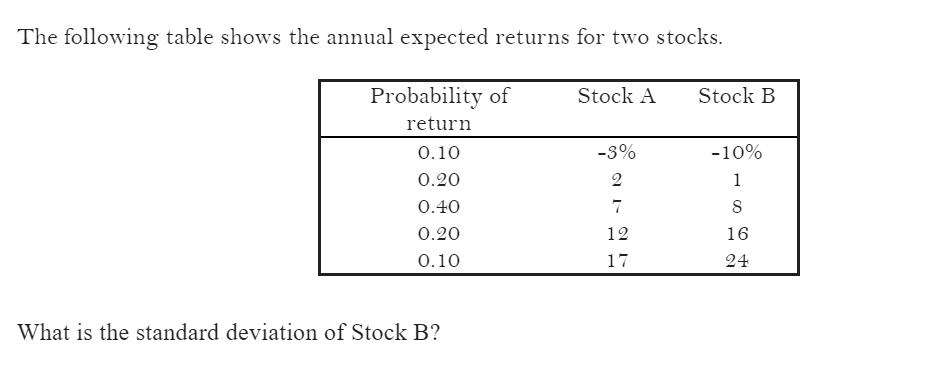
The following table shows the annual expected returns for two stocks. Probability of return Stock A Stock B 0.10 -10% 0.20 21 1 0.40 7 8 0.20 12 0.10 17 27 16 24 What is the standard deviation of Stock B?
Step by Step Solution
There are 3 Steps involved in it
1 Expert Approved Answer
Step: 1 Unlock

Question Has Been Solved by an Expert!
Get step-by-step solutions from verified subject matter experts
Step: 2 Unlock
Step: 3 Unlock