

Question: The following table shows the annual expected returns for two stocks. Probability of return 0.10 0.20 0.40 0.20 0.10 Stock A -3% 2 7 12
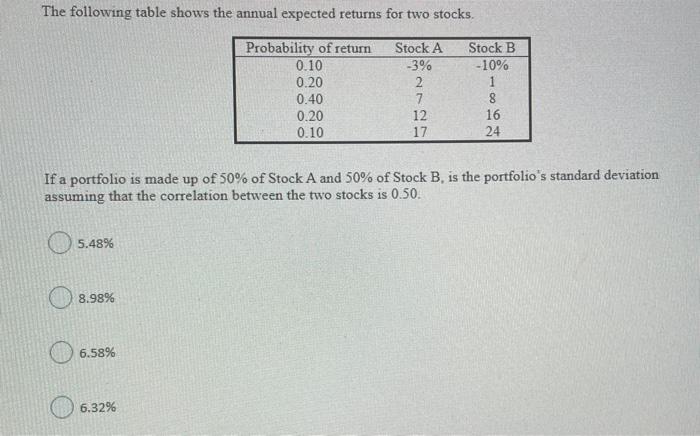
The following table shows the annual expected returns for two stocks. Probability of return 0.10 0.20 0.40 0.20 0.10 Stock A -3% 2 7 12 17 Stock B -10% 1 8 16 24 If a portfolio is made up of 50% of Stock A and 50% of Stock B, is the portfolio's standard deviation assuming that the correlation between the two stocks is 0.50. 5.48% 8.98% 6.58% 6.32%
Step by Step Solution
There are 3 Steps involved in it
1 Expert Approved Answer
Step: 1 Unlock

Question Has Been Solved by an Expert!
Get step-by-step solutions from verified subject matter experts
Step: 2 Unlock
Step: 3 Unlock