

The following table shows the average earnings of various immigrant cohorts and the native born for 2005
Question:
The following table shows the average earnings of various immigrant cohorts and the native born for 2005 and 2010 (all values expressed in 2010 dollars). Note: YSM refers to the average years since migration.
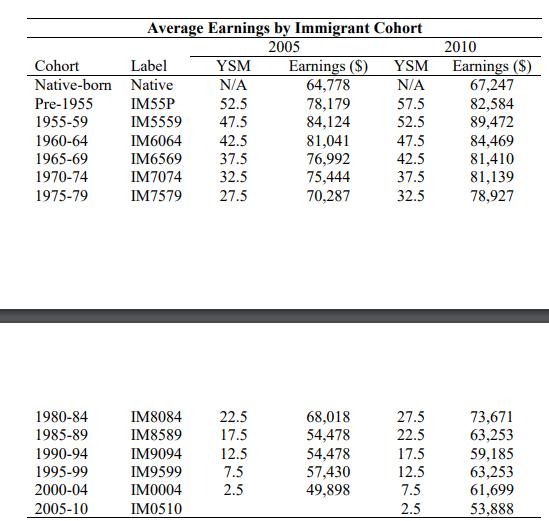
a) Calculate the cross-sectional entry effect (in levels) for the 2000-04 cohort.
b)Use the 2005 cross-section to estimate the effect on earnings of being in Canada and additional five years for the 1990-94 cohort; that is, the effect of being in Canada 17.5 instead of 12.5 years. Use this to predict 1990-94's earnings in 2010.
c) Compare your estimate from part (b) to 1990-94's actual earnings in 2010. Provide a better estimate of the earnings assimilation of the 1990-94 cohort. Explain and interpret. Compare this to the cross-sectional estimate from part (b) and suggest an explanation as to why they are different.
Expert Answer:
a Calculating the crosssectional entry effect in levels for the 200004 cohort The crosssectional ent... View the full answer


Essentials of Business Analytics
ISBN: 978-1285187273
1st edition
Authors: Jeffrey Camm, James Cochran, Michael Fry, Jeffrey Ohlmann, David Anderson, Dennis Sweeney, Thomas Williams
