

Question: The following table shows three time estimate ( Optimistic , Pessimistic, and Most likely ) of a project with 5 activities: ActivityO ( Optimistic time
The following table shows three time estimate Optimistic Pessimistic, and Most likely of a project with activities:ActivityO Optimistic timeM Most likely timeP Pessimistic timeImmediate PredecessorABACBDA CEDConduct a PERT analysis and find the critical path of the project.The following table shows three time estimate Optimistic Pessimistic, and Most likely of a project with activities:ActivityO Optimistic timeM Most likely timeP Pessimistic timeImmediate PredecessorABACBDA CEDConduct a PERT analysis and find the critical path of the project.The following table shows three time estimate Optimistic Pessimistic, and Most likely of a project with activities:ActivityO Optimistic timeM Most likely timeP Pessimistic timeImmediate PredecessorABACBDA CEDConduct a PERT analysis and find the critica
points
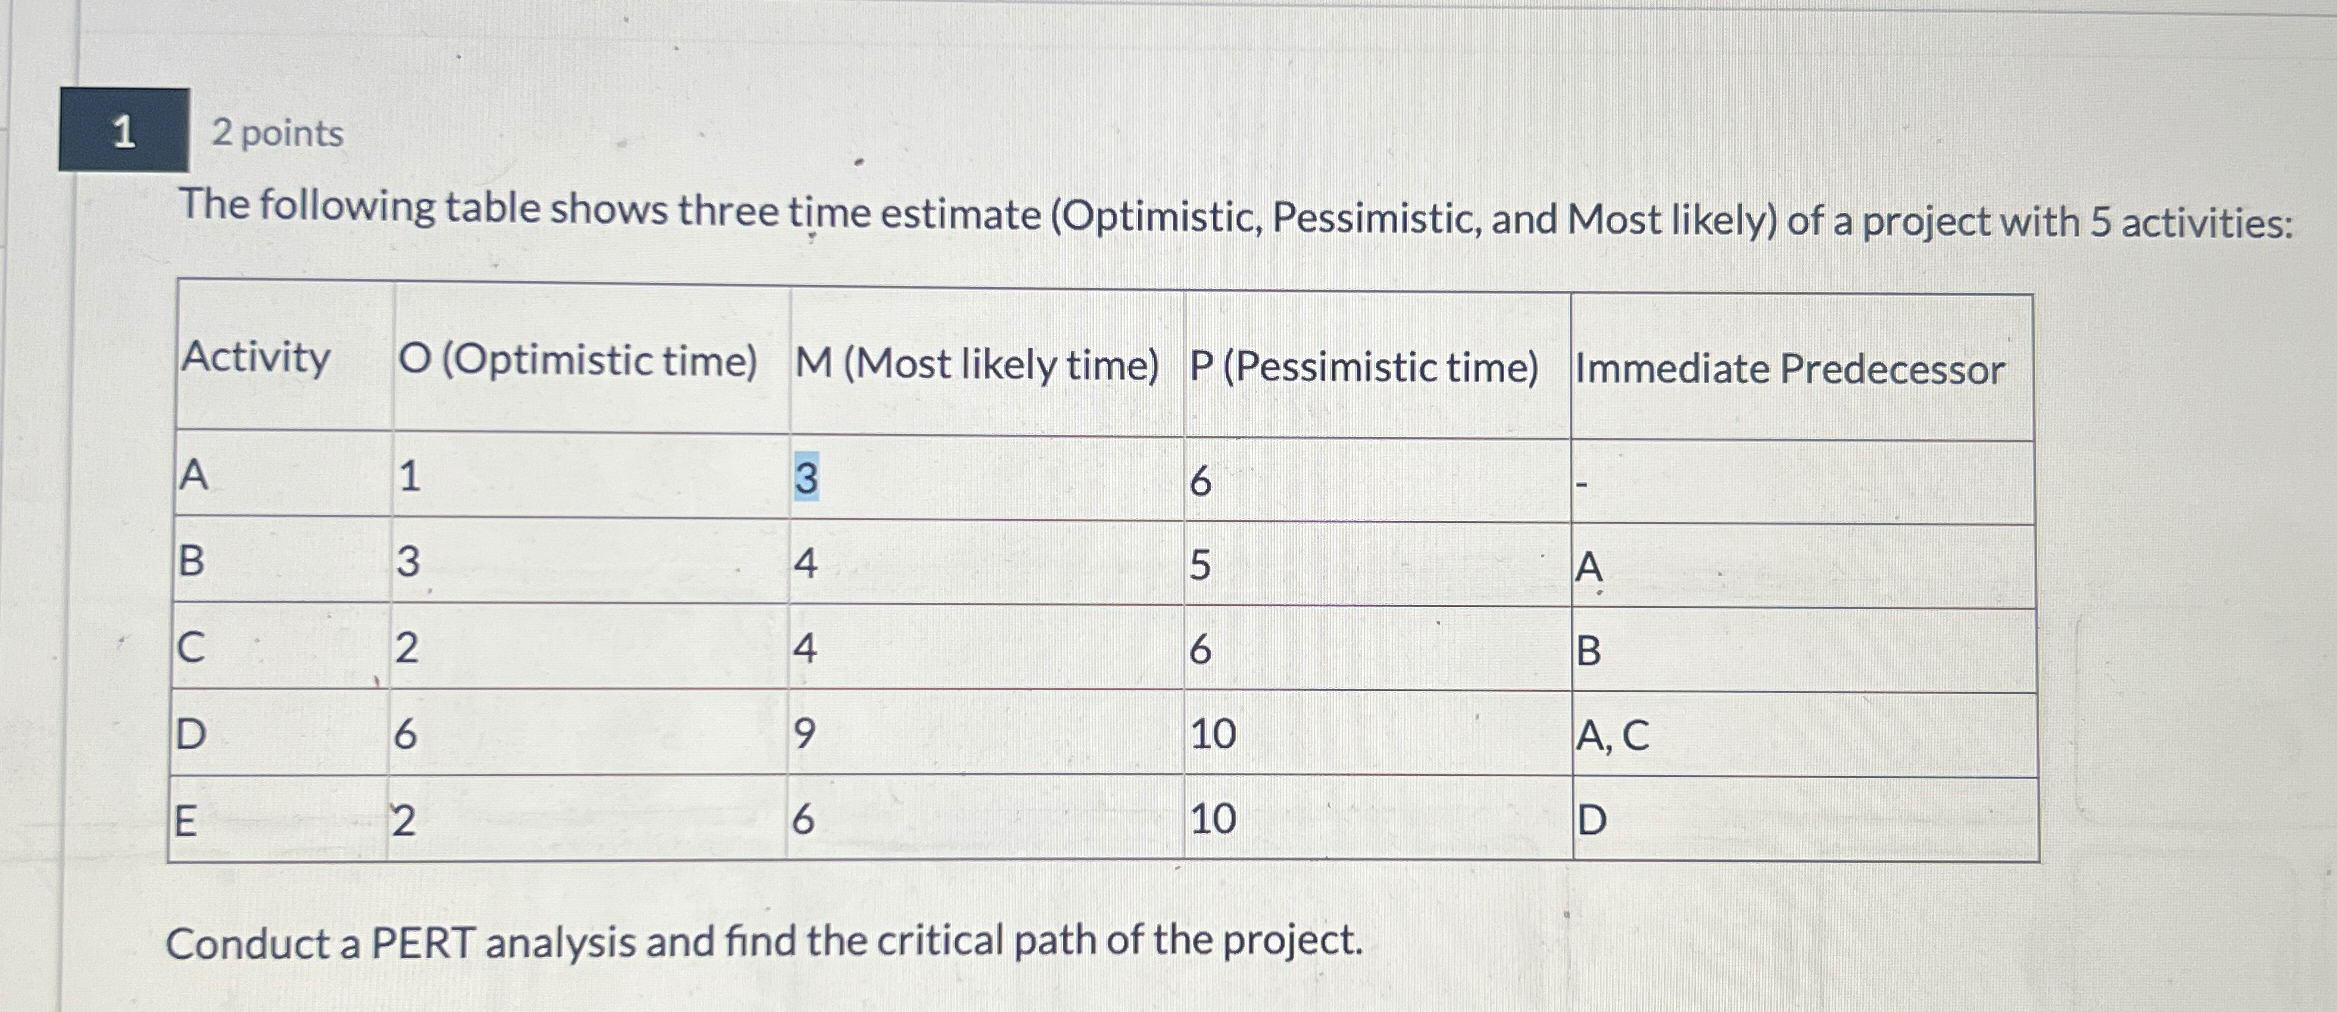
The following table shows three time estimate Optimistic Pessimistic, and Most likely of a project with activities:
tableActivityO Optimistic timeMost likely timePessimistic timeImmediate PredecessorBACBDA CED
Conduct a PERT analysis and find the critical path of the project.l path of the project.
Step by Step Solution
There are 3 Steps involved in it
1 Expert Approved Answer
Step: 1 Unlock

Question Has Been Solved by an Expert!
Get step-by-step solutions from verified subject matter experts
Step: 2 Unlock
Step: 3 Unlock