

Question: The full question please help Question 2 (12 marks) The following table shows lower and upper limit arc capacities as well as a cost of
The full question please help
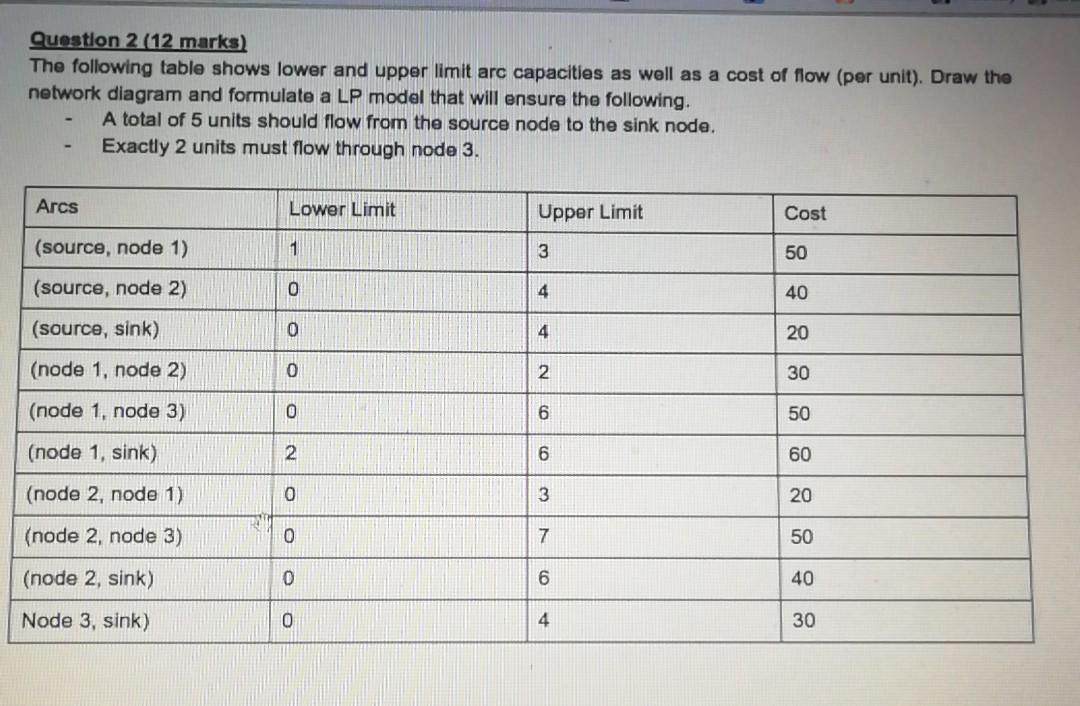
Question 2 (12 marks) The following table shows lower and upper limit arc capacities as well as a cost of flow (per unit). Draw the network diagram and formulate a LP model that will ensure the following. A total of 5 units should flow from the source node to the sink node. Exactly 2 units must flow through node 3. Arcs Lower Limit Upper Limit Cost (source, node 1) 1 3 50 (source, node 2) 0 4 40 (source, sink) 0 4 20 (node 1, node 2) 0 2 30 (node 1. node 3) 0 6 50 (node 1, sink) 2 6 60 (node 2, node 1) 0 3 20 (node 2, node 3) 0 7 50 (node 2, sink) 0 6 40 Node 3, sink) 0 4 30 Question 2 (12 marks) The following table shows lower and upper limit arc capacities as well as a cost of flow (per unit). Draw the network diagram and formulate a LP model that will ensure the following. A total of 5 units should flow from the source node to the sink node. Exactly 2 units must flow through node 3. Arcs Lower Limit Upper Limit Cost (source, node 1) 1 3 50 (source, node 2) 0 4 40 (source, sink) 0 4 20 (node 1, node 2) 0 2 30 (node 1. node 3) 0 6 50 (node 1, sink) 2 6 60 (node 2, node 1) 0 3 20 (node 2, node 3) 0 7 50 (node 2, sink) 0 6 40 Node 3, sink) 0 4 30
Step by Step Solution
There are 3 Steps involved in it

Get step-by-step solutions from verified subject matter experts