

Question: The given data represents a frequency distribution of the F scale intensities of recent tornadoes Use the frequency distribution to construct a frequency polygon Does

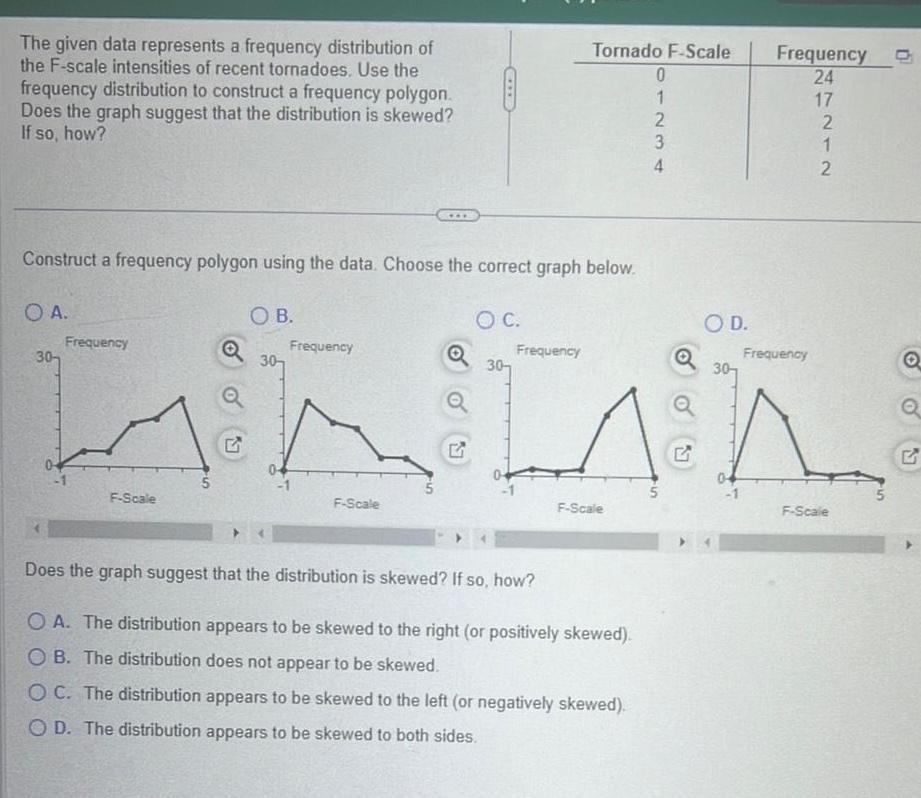
The given data represents a frequency distribution of the F scale intensities of recent tornadoes Use the frequency distribution to construct a frequency polygon Does the graph suggest that the distribution is skewed If so how Construct a frequency polygon using the data Choose the correct graph below OA 30 Frequency F Scale 5 Q OB Frequency 307 F Scale Q O C Tornado F Scale Frequency F Scale Does the graph suggest that the distribution is skewed If so how OA The distribution appears to be skewed to the right or positively skewed OB The distribution does not appear to be skewed O C The distribution appears to be skewed to the left or negatively skewed OD The distribution appears to be skewed to both sides 0 1 2 3 4 O D Frequency O 24 Frequency 27212 F Scale Q Q
Step by Step Solution
There are 3 Steps involved in it

Get step-by-step solutions from verified subject matter experts